admin
DataFrame.plot.area(x=None, y=None, **kwargs)
Description:
Draw a stacked area plot.
An area plot displays quantitative data visually.
This function wraps the matplotlib area function.
Parameters:
DataFrame.plot()
Returns:
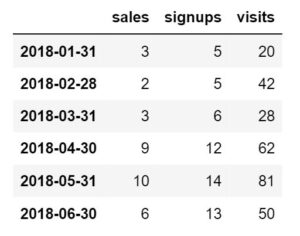
df = pd.DataFrame({
    'sales': [3, 2, 3, 9, 10, 6],
    'signups': [5, 5, 6, 12, 14, 13],
    'visits': [20, 42, 28, 62, 81, 50],
}, index=pd.date_range(start='2018/01/01', end='2018/07/01',
                       freq='M'))
df
ax = df.plot.area()
ax = df.plot.area(stacked=False)
ax = df.plot.area(y='sales')
df = pd.DataFrame({
    'sales': [3, 2, 3],
    'visits': [20, 42, 28],
    'day': [1, 2, 3],
})
df
ax = df.plot.area(x='day')
Your email address will not be published. Required fields are marked *
Comment *
Name *
Email *
Website
Save my name, email, and website in this browser for the next time I comment.