admin
DataFrame.plot.pie(**kwargs)
Description:
Generate a pie plot.
A pie plot is a proportional representation of the numerical data in a column. This function wraps matplotlib.pyplot.pie() for the specified column.
matplotlib.pyplot.pie()
If no column reference is passed and subplots=True a pie plot is drawn for each numerical column independently.
subplots=True
Parameters:
DataFrame.plot()
Returns:
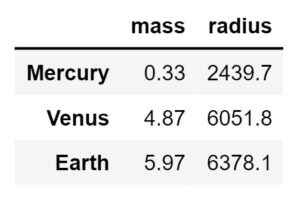
df = pd.DataFrame({'mass': [0.330, 4.87 , 5.97],
                   'radius': [2439.7, 6051.8, 6378.1]},
                  index=['Mercury', 'Venus', 'Earth'])
df
plot = df.plot.pie(y='mass', figsize=(5, 5))
plot = df.plot.pie(subplots=True, figsize=(11, 6))
Your email address will not be published. Required fields are marked *
Comment *
Name *
Email *
Website
Save my name, email, and website in this browser for the next time I comment.