What Is Statistical Distribution?
Table Of Contents:
- What Is Statistical Distribution?
- Why It Is Important?
- Types Of Statistical Distributions.
(1) What Is Statistical Distribution?
- A data distribution is a function or a listing that shows all the possible values (or intervals) of the data.
- Often, the data in a distribution will be ordered from smallest to largest, and graphs and charts allow you to easily see both the values and the frequency with which they appear.
- This distribution describes the grouping or the density of the observations, called the probability density function.
- Once you know the data distribution you can calculate the probability of any one particular observation in the sample space or the likelihood that an observation will have a value that is less than (or greater than) a point of interest.
- Take for example when you roll a die you can have ‘6’ outcomes.
- The probability of getting ‘5’ is 1/6 .
(2) Why It Is Important?
- Once you know the distribution of the data you will know all the possible values of a variable.
- After you know all the possible values you can find out the probability of any value in the sample space.
- Hence the distribution of the variable is important to know while calculating the probability of any value.
- After you know the probability value you can test your ‘Hypothesis’ and can perform a ‘Data Science’ operation.
(3) Types Of Statistical Distribution.
- Different scientists have derived the data distribution mathematical functions.
- By using that we will know all the possible values of a variable.
- After that, we can find out the probability of individual values in that population data.
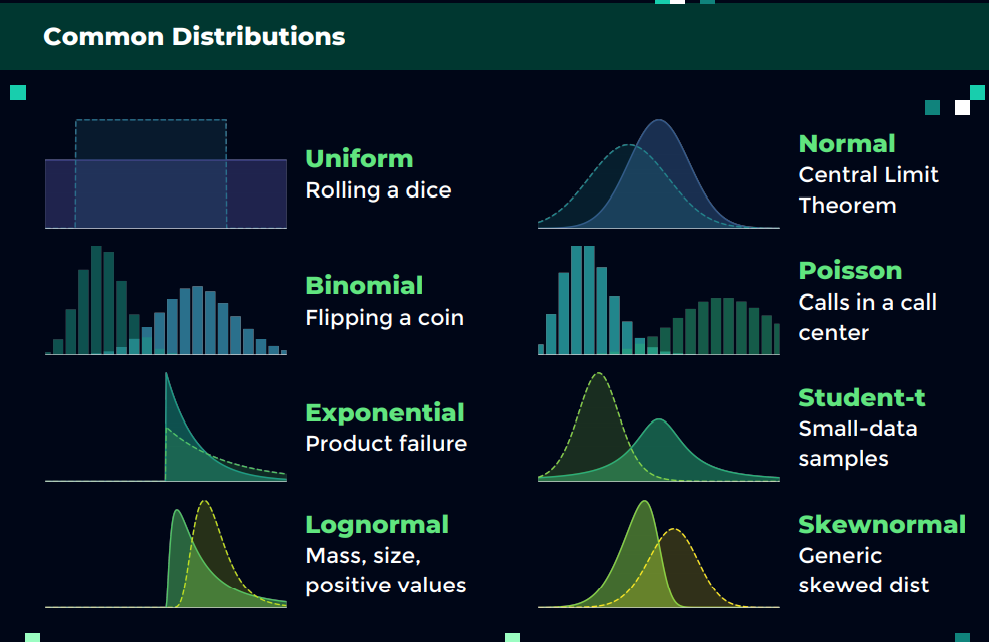
Types Of Statistical Distributions:
- Uniform Distribution.
- Binomial Distribution.
- Bernoulli Distribution.
- Poisson Distribution.
- Normal Distribution.
- T – Distribution.
- Exponential Distribution.