What Is Standard Normal Distribution?
Table Of Contents:
- What Is Standard Normal Distribution?
- Formula For Standard Normal Distribution.
- Diagram For Standard Normal Distribution.
- Examples Of Standard Normal Distribution.
(1) What Is Standard Normal Distribution?
- The standard normal distribution, also called the z-distribution, is a special normal distribution where the mean is 0 and the standard deviation is 1.
- Every normal distribution is a version of the standard normal distribution that’s been stretched or squeezed and moved horizontally right or left.
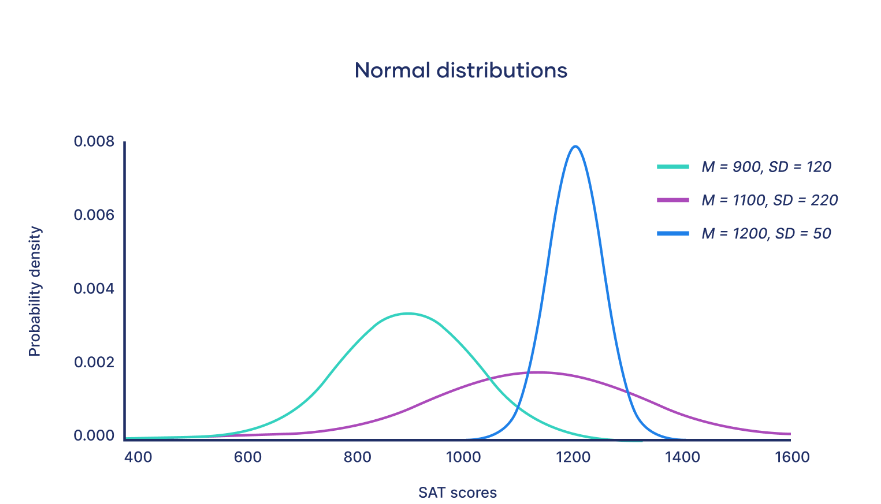
- While individual observations from normal distributions are referred to as x, they are referred to as z in the z-distribution.
- Every normal distribution can be converted to the standard normal distribution by turning the individual values into z-scores.
- Z-scores tell you how many standard deviations away from the mean each value lies.
(2) Formula For Standard Normal Distribution?
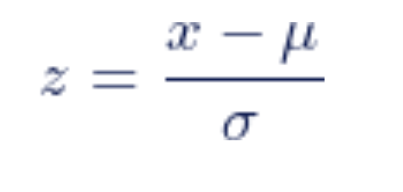
- x = Individual Value
- μ = Population Mean
- σ = Population Standard Deviation
- You only need to know the mean and standard deviation of your distribution to find the z-score of a value.
- We convert normal distributions into the standard normal distribution for several reasons:
- To find the probability of observations in a distribution falling above or below a given value.
- To find the probability that a sample mean significantly differs from a known population mean.
- To compare scores on different distributions with different means and standard deviations.
- Each z-score is associated with a probability or p-value, that tells you the likelihood of values below that z-score occurring.
- If you convert an individual value into a z-score, you can then find the probability of all values up to that value occurring in a normal distribution.
(3) Diagram For Standard Normal Distribution?
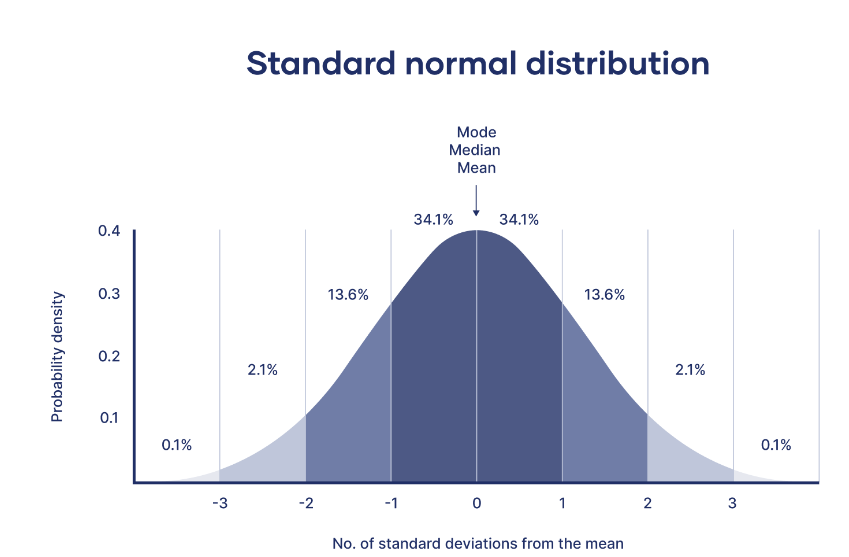
- The standard normal distribution, also called the z-distribution, is a special normal distribution where the mean is 0 and the standard deviation is 1.
(4) Examples Of Standard Normal Distribution?
Example-1: Question
- For some computers, the time period between charges of the battery is normally distributed with a mean of 50 hours and a standard deviation of 15 hours.
- Rohan has one of these computers and needs to know the probability that the time period will be between 50 and 70 hours.
Solution:
Let x be the random variable that represents the time period.
Given Mean, μ= 50
and standard deviation, σ = 15
To find: Pprobability that x is between 50 and 70 or P( 50< x < 70)
By using the transformation equation, we know;
z = (X – μ) / σ
For x = 50 , z = (50 – 50) / 15 = 0
For x = 70 , z = (70 – 50) / 15 = 1.33
P( 50< x < 70) = P( 0< z < 1.33) = [area to the left of z = 1.33] – [area to the left of z = 0]
From the table we get the value, such as;
P( 0< z < 1.33) = 0.9082 – 0.5 = 0.4082
The probability that Rohan’s computer has a time period between 50 and 70 hours is equal to 0.4082.
Example-2: Question
- The speeds of cars are measured using a radar unit, on a motorway. The speeds are normally distributed with a mean of 90 km/hr and a standard deviation of 10 km/hr.
- What is the probability that a car selected at chance is moving at more than 100 km/hr?
Solution:
Let the speed of cars is represented by a random variable ‘x’.
Now, given mean, μ = 90 and standard deviation, σ = 10.
To find: Probability that x is higher than 100 or P(x > 100)
By using the transformation equation, we know;
z = (X – μ) / σ
Hence,
For x = 100 , z = (100 – 90) / 10 = 1
P(x > 90) = P(z > 1) = [total area] – [area to the left of z = 1]
P(z > 1) = 1 – 0.8413 = 0.1587