GINI Index In Decision Tree
Table Of Contents:
- What Is the GINI Index?
- Interpreting GINI Index.
- Example Of GINI Index.
- What Is the GINI Coefficient?
(1) What Is GINI Index?
- The Gini index, also known as the Gini impurity, is a measure used in decision tree algorithms to quantify the impurity or randomness of a set of examples within a particular node.
- It is an alternative criterion, alongside entropy, for determining the best feature to split the data.
- The Gini index is calculated based on the distribution of class labels within a node.
- It measures the probability of incorrectly classifying a randomly chosen example within that node if it were labelled randomly according to the class distribution.

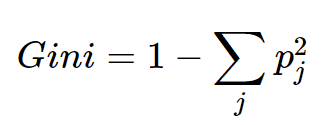
where,
‘pi’ is the probability of an object being classified to a particular class.While building the decision tree, we would prefer to choose the attribute/feature with the least Gini Index as the root node.
(2) Interpreting GINI Index.
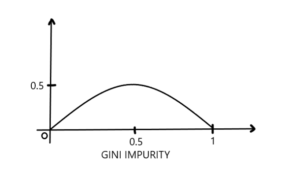
- The Gini index ranges from 0 to 1.
- A Gini index of 0 indicates a pure node with all examples belonging to the same class,
- while a Gini index of 1 indicates an impure node with an equal distribution of examples from different classes.
- A value of 0.5 denotes the elements are uniformly distributed into some classes.
- When building a decision tree, the algorithm aims to minimize the Gini index by selecting the feature that results in the greatest reduction in the Gini index after the split.
- This reduction in the Gini index is often referred to as “Gini gain” or “Gini impurity reduction.”
- The feature with the highest Gini gain is chosen as the splitting criterion for that node.
(3) Example Of GINI Index.
Certainly! Let’s continue with the email classification example and calculate the Gini index for the “Sender Domain” feature at the root node.
Suppose we have the following dataset:
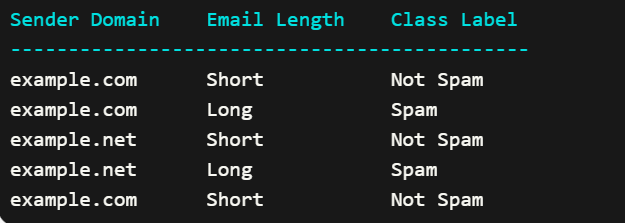
- We want to determine the Gini index for the “Sender Domain” feature at the root node.
Step 1: Calculate the Gini index of the parent node (before the split):
Using the formula for Gini index, we calculate the Gini index of the parent node:
Gini Index(parent) = 1 – ((0.4)^2 + (0.6)^2)
= 1 – (0.16 + 0.36)
= 1 – 0.52
= 0.48Step 2: Calculate the Gini index of the child nodes (after the split) for each possible outcome of the “Sender Domain” feature:
a) When Sender Domain is “example.com”:
- Number of “Spam” emails: 1
- Number of “Not Spam” emails: 2
Total number of emails for Sender Domain “example.com”: 3
Proportion of “Spam” emails: 1/3 = 0.333
Proportion of “Not Spam” emails: 2/3 = 0.667Gini Index(child_example.com) = 1 – ((0.333)^2 + (0.667)^2)
= 1 – (0.111 + 0.445)
= 1 – 0.556
= 0.444b) When Sender Domain is “example.net”:
- Number of “Spam” emails: 1
- Number of “Not Spam” emails: 0
Total number of emails for Sender Domain “example.net”: 1
Proportion of “Spam” emails: 1/1 = 1.0
Proportion of “Not Spam” emails: 0/1 = 0.0Gini Index(child_example.net) = 1 – ((1.0)^2 + (0.0)^2)
= 1 – (1.0 + 0.0)
= 1 – 1.0
= 0.0Step 3: Calculate the weighted average of the child node Gini indices:
- Proportion of emails with Sender Domain “example.com”: 3/5 = 0.6
- Proportion of emails with Sender Domain “example.net”: 2/5 = 0.4
Weighted Average Gini Index = (0.6 * Gini Index(child_example.com)) + (0.4 * Gini Index(child_example.net))
= (0.6 * 0.444) + (0.4 * 0.0)
= 0.2664Step 4: Calculate the Gini gain:
Gini Gain = Gini Index(parent) – Weighted Average Gini Index
= 0.48 – 0.2664
= 0.2136Therefore, the Gini gain for the “Sender Domain” feature at the root node is approximately 0.2136.
A higher Gini gain indicates that splitting the data based on the “Sender Domain” feature will result in a greater reduction in the Gini index and better separation of the class labels.
(4) What Is GINI Coefficient ?
- In economics, the Gini coefficient (/ˈdʒiːni/ JEE-nee), also known as the Gini index or Gini ratio, is a measure of statistical dispersion intended to represent the income inequality, the wealth inequality, or the consumption inequality[3] within a nation or a social group.
- It was developed by Italian statistician and sociologist Corrado Gini.
- The Gini coefficient measures the inequality among the values of a frequency distribution, such as levels of income.
- A Gini coefficient of 0 reflects perfect equality, where all income or wealth values are the same, while a Gini coefficient of 1 (or 100%) reflects maximal inequality among values, a situation where a single individual has all the income while all others have none.[4][5]