-
What Is Exponential Distribution?
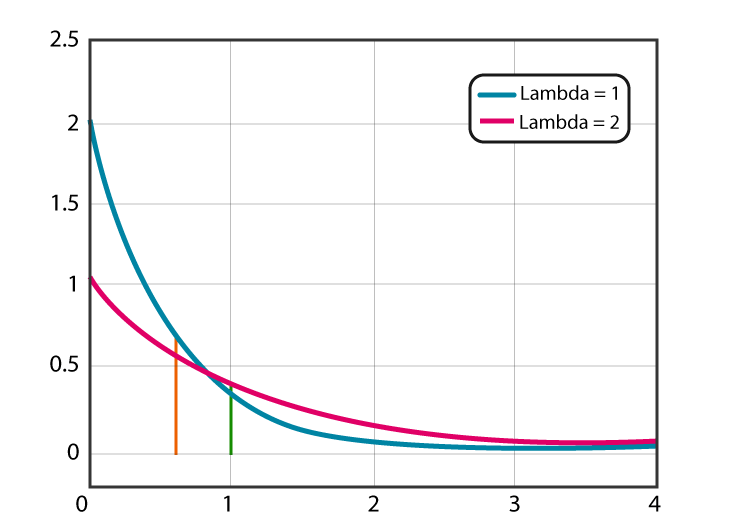
What Is Exponential Distribution? Table Of Contents: What Is Exponential Distribution? Formula For Exponential Distribution. Diagram For Exponential Distribution. Examples Of Exponential Distribution. (1) What Is Exponential Distribution? The Exponential Distribution is a continuous distribution that is commonly used to measure the expected time for an event to occur. For example, in physics, it is often used to measure radioactive decay. In engineering, it is used to measure the time associated with receiving a defective part on an assembly line. In finance, it is often used to measure the likelihood of the next default for a portfolio of financial assets. For
-
What Is Student T Distribution ?
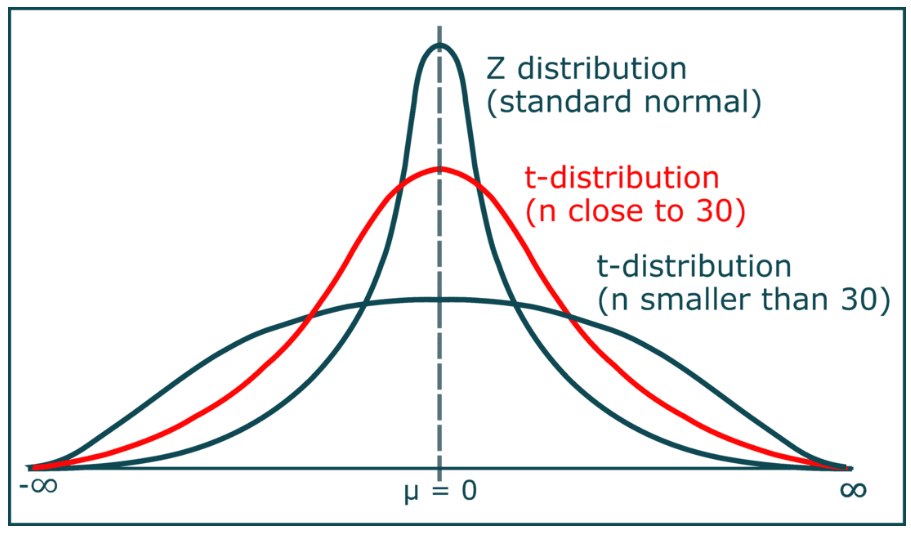
What Is Student’s T – Distribution? Table Of Contents: What is Student’s T – Distribution? Formula For Student’s T – Distribution. Diagram For Student’s T – Distribution. Examples Of Student’s T – Distribution. (1) What Is Student’s T – Distribution? Student’s t-distribution, also known as the t-distribution, is a continuous probability distribution that is used in statistics for making inferences about the population mean when the sample size is small or when the population standard deviation is unknown. It is similar to the standard normal distribution (Z-distribution), but it has heavier tails. The t-distribution is used instead of the normal
-
What Is Standard Normal Distribution?
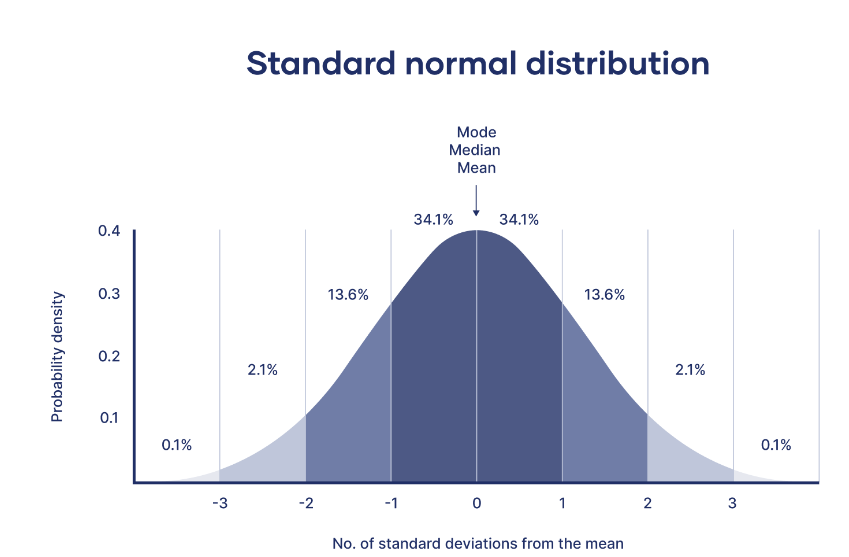
What Is Standard Normal Distribution? Table Of Contents: What Is Standard Normal Distribution? Formula For Standard Normal Distribution. Diagram For Standard Normal Distribution. Examples Of Standard Normal Distribution. (1) What Is Standard Normal Distribution? The standard normal distribution, also called the z-distribution, is a special normal distribution where the mean is 0 and the standard deviation is 1. Every normal distribution is a version of the standard normal distribution that’s been stretched or squeezed and moved horizontally right or left. While individual observations from normal distributions are referred to as x, they are referred to as z in the z-distribution. Every normal distribution can be converted
-
What Is Normal Distribution?
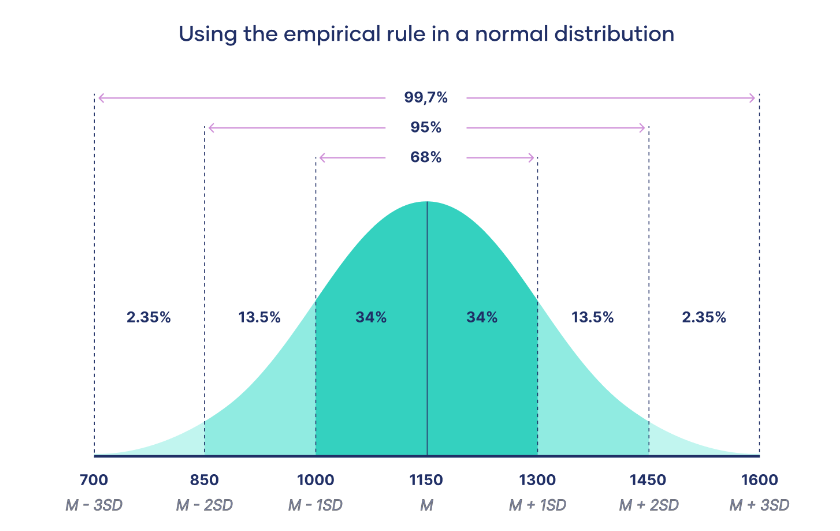
What Is Normal Distribution? Table Of Contents: What Is Normal Distribution? Characteristics Of Normal Distribution. Formula For Normal Distribution. Diagram For Normal Distribution. Empirical Rule. Difference Between Probability Function & Probability Density Function. Examples Of Normal Distribution. (1) What Is Normal Distribution? Normal Distribution, also called the Gaussian Distribution, is the most significant Continuous Probability Distribution. Sometimes it is also called a bell curve. A normal distribution is a type of continuous probability distribution in which most data points cluster toward the middle of the range, while the rest extends symmetrically toward either extreme. (2) Characteristics Of Normal Distribution. Normal Distributions
-

What Is Poisson Distribution?
What Is Poisson Distribution Table Of Contents: What Is Poisson Distribution? Formula For Poisson Distribution. Diagram Of Poisson Distribution. Examples Of Poisson Distribution. (1) What Is Poisson Distribution? A Poisson Distribution is a discrete probability distribution. It gives the probability of an event happening a certain number of times (k) within a given interval of time or space. The Poisson Distribution has only one parameter, λ (lambda), which is known constant mean rate. We must know from the history about the mean or average value of that event. (2) Formula For Poisson Distribution. e is Euler’s number (e = 2.71828…) x is the number of occurrences
-

What Is Bernoulli Distribution?
What Is Bernoulli Distribution? Table Of Contents: What Is Bernoulli Distribution? Formula For Bernoulli Distribution. Diagram For Bernoulli Distribution. Examples Of Bernoulli Distribution. What Is A Bernoulli Trail? Difference in Binomial and Bernoulli Distribution. (1) What Is Bernoulli Distribution? Bernoulli Distribution applies to events that have one trial and two possible outcomes. Bernoulli Distribution is a discrete probability distribution, meaning it’s concerned with discrete random variables. A discrete random variable is one that has a finite or countable number of possible values—the number of heads you get when tossing three coins at once, or the number of students in a class. (2) Formula
-
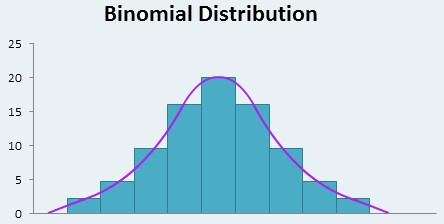
What Is Binomial Distribution?
What Is Binomial Distribution? Table Of Contents: What Is Binomial Distribution? Formula For Binomial Distribution. Diagram For Binomial Distribution. Examples Of Binomial Distribution. (1) What Is Binomial Distribution? The Binomial Distribution is the discrete probability distribution that gives only two possible results in an experiment, either Success or Failure. For example, if we toss a coin, there could be only two possible outcomes: heads or tails, and if any test is taken, then there could be only two results: pass or fail. Binomial Distribution is the extension of Uniform Distribution because in Uniform Distribution you will do the experiment only once and
-
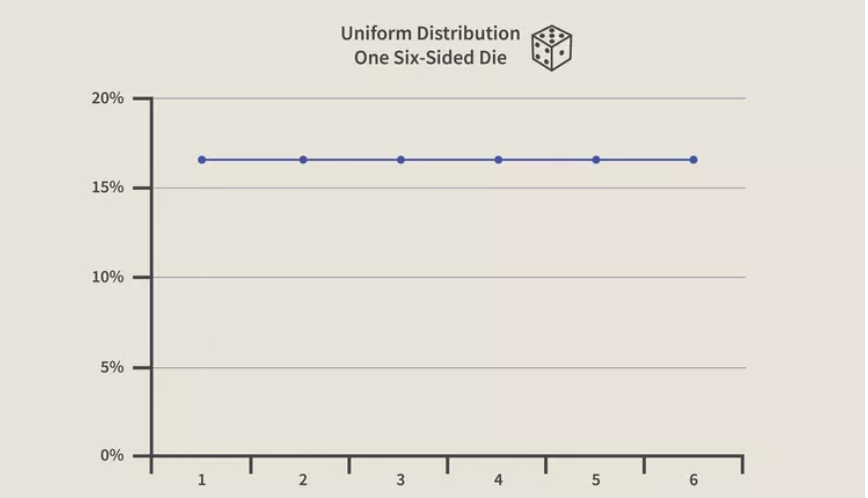
What Is Uniform Distribution?
What Is Uniform Distribution? Table Of Content: What Is Uniform Distribution? Formula For Uniform Distribution. Example Of Uniform Distribution. (1) What Is Uniform Distribution? In statistics, uniform distribution refers to a type of probability distribution in which all outcomes are equally likely. A deck of cards has within it uniform distributions because the likelihood of drawing a heart, a club, a diamond, or a spade is equally likely. A coin also has a uniform distribution because the probability of getting either heads or tails in a coin toss is the same. The uniform distribution can be visualized as a straight horizontal line, so for
-
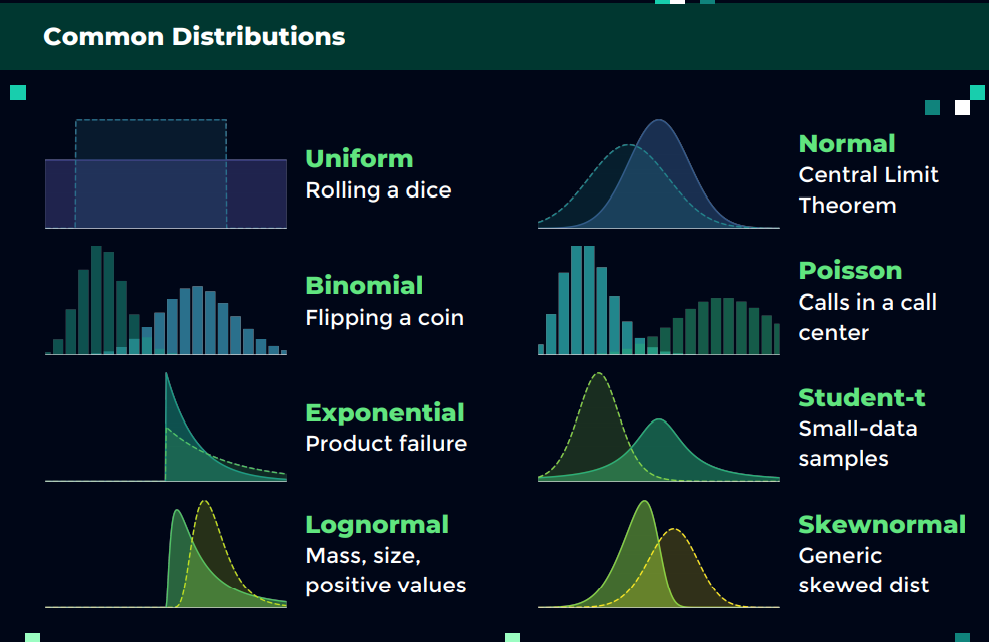
What Is Statistical Distribution ?
What Is Statistical Distribution? Table Of Contents: What Is Statistical Distribution? Why It Is Important? Types Of Statistical Distributions. (1) What Is Statistical Distribution? A data distribution is a function or a listing that shows all the possible values (or intervals) of the data. Often, the data in a distribution will be ordered from smallest to largest, and graphs and charts allow you to easily see both the values and the frequency with which they appear. This distribution describes the grouping or the density of the observations, called the probability density function. Once you know the data distribution you can calculate the probability of
-
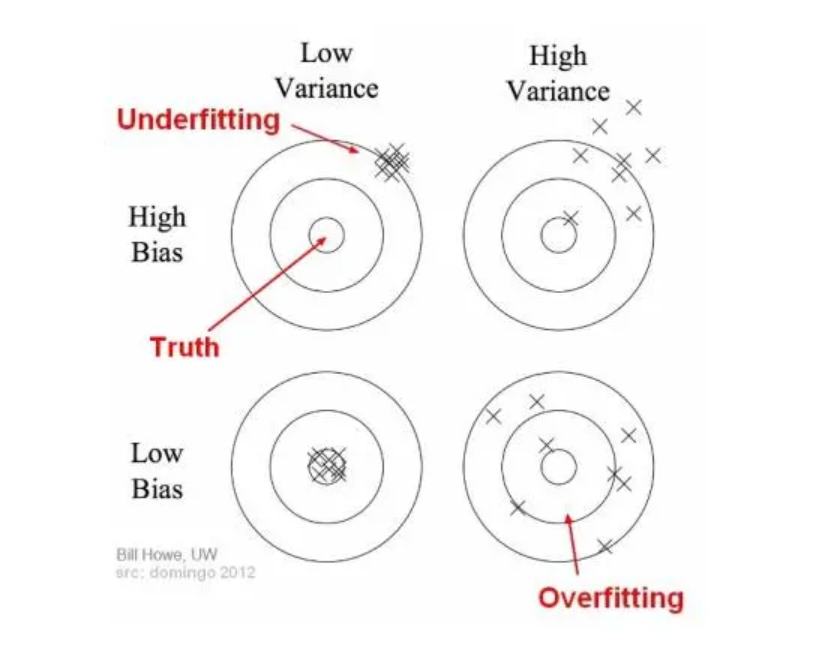
What Is Bias & Variance Tradeoff?
What Is Bias & Variance Tradeoff? Table Of Contents: What Is Bias & Variance? Problem With High Bias & High Variance. Way To Reduce High Bias & Variance. What Is Bias & Variance Tradeoff? (1) What Is Bias & Variance ? Bias: Bias in collecting sample data set refers to the tendency of inclining towards particular group or community based on the preference of data collector. High bias in the data set will not accurately represents the entire population. Hence your statistical analysis will be wrong about the population. Variance: Variance in the sample dataset refers to, how far the
