
Entropy In Decision Tree
Table Of Contents:
- What Is Entropy?
- Interpreting Entropy.
- Formula For Entropy.
- How Decision Tree Uses Entropy?
(1) What Is Entropy?
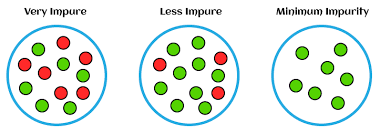
- Entropy is a concept used in the context of decision trees to measure the impurity or randomness of a set of examples within a particular node.
- In Decision Tree algorithms, Entropy is used as a criterion to determine the best feature for splitting the data.
- In the context of decision trees, entropy is calculated based on the distribution of class labels within a node.
- If a node contains only examples from a single class, it is considered pure and has an entropy of 0.
- On the other hand, if a node contains an equal number of examples from different classes, it is considered impure and has a higher entropy.
(2) Interpreting Entropy.
- The entropy value ranges from 0 to 1.
- A value of 0 indicates a pure node with all examples belonging to the same class,
- while a value of 1 indicates an impure node with an equal distribution of examples from different classes.
- When building a decision tree, the algorithm aims to minimize entropy by selecting the feature that results in the greatest reduction in entropy after the split.
- This reduction in entropy is often referred to as “information gain.”
- The feature with the highest information gain is chosen as the splitting criterion for that node.
- By using entropy as a measure of impurity, decision trees can effectively split the data based on the most informative features, leading to better classification or regression performance.
- The split that minimizes entropy leads to more homogeneous subsets with respect to the target variable, improving the predictive power of the decision tree model.
(3) Formula For Entropy.
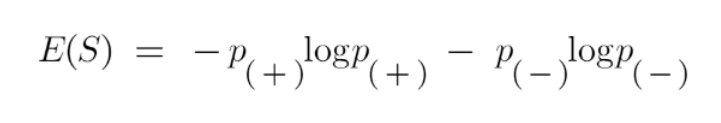
Here,
- p+ is the probability of positive class
- p– is the probability of negative class
- S is the subset of the training example
(4) How Decision Tree Uses Entropy.
Example-1
Now we know what entropy is and what is its formula, Next, we need to know that how exactly does it work in this algorithm.
Entropy basically measures the impurity of a node. Impurity is the degree of randomness; it tells how random our data is.
A pure sub-split means that either you should be getting “yes”, or you should be getting “no”.
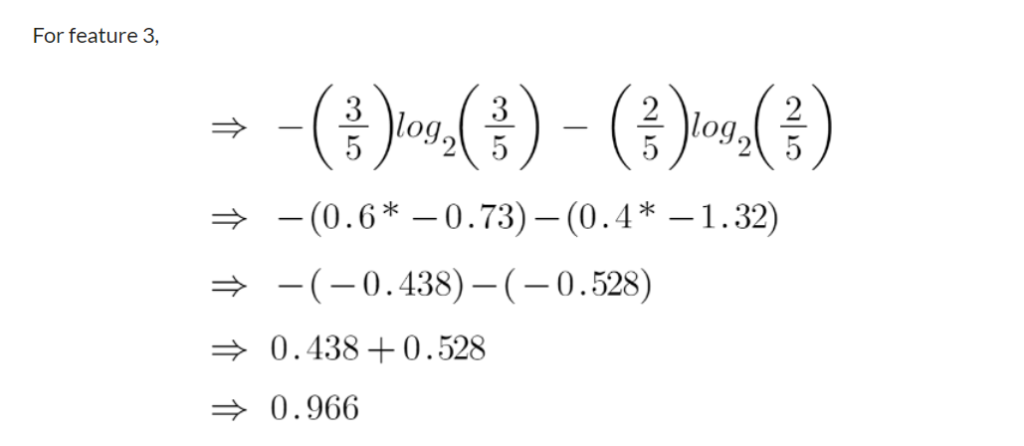
Supposea featurehas 8 “yes” and 4 “no” initially, after the first split the left node gets 5 ‘yes’ and 2 ‘no’whereas right node gets 3 ‘yes’ and 2 ‘no’.
We see here the split is not pure, why? Because we can still see some negative classes in both nodes.
In order to make a decision tree, we need to calculate the impurity of each split, and when the purity is 100%, we make it as a leaf node.
To check the impurity of feature 2 and feature 3 we will take the help for Entropy formula.
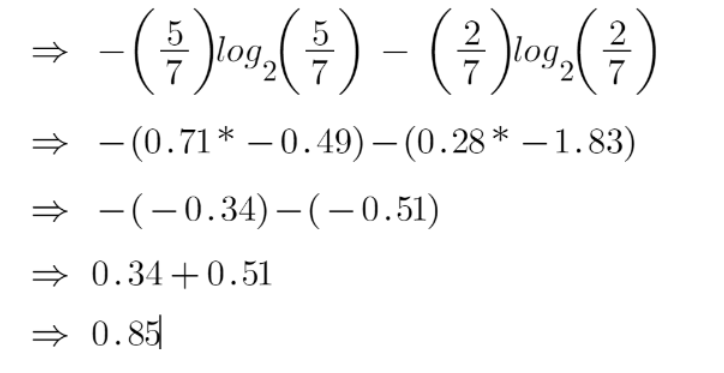
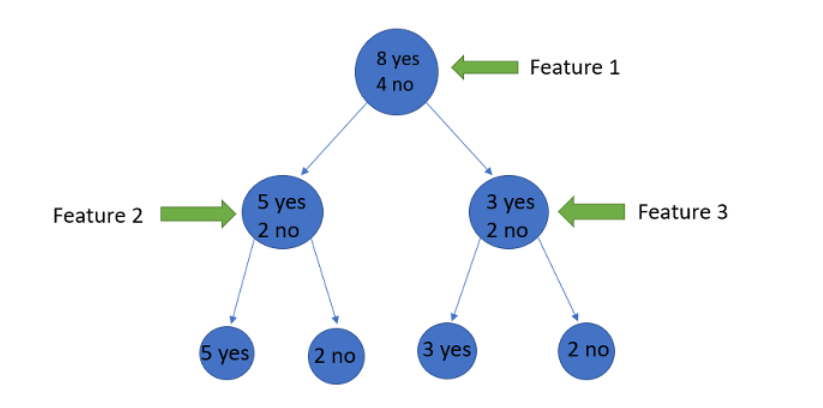
We can clearly see from the tree itself that left node has low entropy or more purity than right node since left node has a greater number of “yes” and it is easy to decide here.
Always remember that the higher the Entropy, the lower will be the purity and the higher will be the impurity.
As mentioned earlier the goal of machine learning is to decrease the uncertainty or impurity in the dataset, by using the entropy we are getting the impurity of a particular node, we don’t know if the parent entropy or the entropy of a particular node has decreased or not.
For this, we bring a new metric called “Information gain” which tells us how much the parent entropy has decreased after splitting it with some feature.
Example-2
- Let’s consider an example to illustrate how entropy is calculated in a decision tree.
- Suppose we have a dataset of 100 emails, and we want to build a decision tree to classify them as either “spam” or “not spam” based on two features: “sender domain” and “email length.”
- The target variable is the email’s class label (“spam” or “not spam”).
Here is a simplified subset of the dataset:
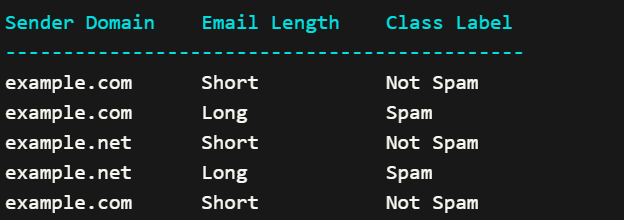
To calculate the entropy at a specific node, we consider the distribution of class labels within that node. Let’s calculate the entropy at the root node of our decision tree using the above dataset.
First, we determine the proportion (probability) of each class label in the root node:
- Number of “Spam” emails: 2
- Number of “Not Spam” emails: 3
- Total number of emails in the root node: 5
Proportion of “Spam” emails: 2/5 = 0.4
Proportion of “Not Spam” emails: 3/5 = 0.6
Next, we calculate the entropy using the formula:
Entropy = – (0.4 * log2(0.4)) – (0.6 * log2(0.6))
Calculating the values:
Entropy = – (0.4 * (-0.736)) – (0.6 * (-0.442))
= 0.294 + 0.265
= 0.559
The entropy at the root node is approximately 0.559.
This entropy value represents the impurity or randomness in the class labels within the root node. A higher entropy value indicates a more mixed or impure distribution of class labels.
In the decision tree algorithm, we aim to minimize entropy by selecting the feature that provides the greatest reduction in entropy (or highest information gain) when splitting the data.
By iteratively selecting features and calculating entropy at each node, the decision tree algorithm constructs the tree structure that optimally partitions the data based on the available features and their information gain.