Interpretation Of Logistic Regression Coefficients.
Table Of Contents:
- Understanding Logistic Regression Model.
- What Is Odd Ratio?
- What Is Log Odd Ratio?
- Examples Of Coefficients Interpretation.
- From Log Odds To Probability.
- Interpreting Coefficients.
- Examples Of Interpreting Coefficients.
- Interpreting Standard Error.
- How To Interpret Intercept?
- Odd Ratio Interpretation.
- More Reading Links.
(1) Understanding Logistic Regression Model.
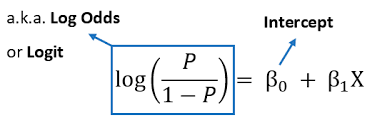
- Here’s what a Logistic Regression model looks like:

- You notice that it’s slightly different from a linear model.
- Let’s clarify each bit of it.
- logit(p) is just a shortcut for log(p/1-p), where p = P{Y = 1}, i.e. the probability of “success”, or the presence of an outcome.
- X₁ and X₂ are the predictor variables, and b and c are their corresponding coefficients, each of which determines the emphasis X₁ and X₂ have on the final outcome Y (or p).
- Last, a is simply the intercept.
We can still use the old logic and say that a 1 unit increase in, say, X₁ will result in b increase in logit(p).
But now we have to dive deeper into the statement “a 1 unit increase in X₁ will result in b increase in logit(p)”.
The first portion is clear, but we can’t really sense the b increase in logit(p).
What does this mean at all?
- To understand this, let’s first unwrap logit(p).
- As mentioned before, logit(p) = log(p/1-p), where p is the probability that Y = 1.
- Y can take two values, either 0 or 1.
- P{Y=1} is called the probability of success.
- Hence logit(p) = log(P{Y=1}/P{Y=0}).
- This is called the log-odds ratio.
(2) What Is Odd Ratio ?
- Odd Ratio = Probability Of Success / Probability Of Failure.
- You’ve probably heard of odds before — e.g. the odds of winning a casino game.
- People often mistakenly believe that odds & probabilities are the same things.
- They’re not.
- Here’s an example:
- The probability of getting a 4 when throwing a fair 6-sided dice is 1/6 or ~16.7%.
- On the other hand, the odds of getting a 4 are 1:5, or 20%. This is equal to p/(1-p) = (1/6)/(5/6) = 20%.
- So, the odds ratio represents the ratio of the probability of success and the probability of failure.
- Switching from odds to probabilities and vice versa is fairly simple.
Super Note:
- In the case of Probability, we will consider either the probability of success or the probability of failure.
- But “Odds” will consider both success and failure in the equation.
- It is the ratio of the Probability of Success divided by the Probability of Failure.
(3) What Is Log Odd Ratio ?
- Now, the log-odds ratio is simply the logarithm of the odds ratio.
- The reason logarithm is introduced is simply because the logarithmic function will yield a lovely normal distribution while shrinking extremely large values of P{Y=1}/P{Y=0}.
- Also, the logarithmic function is monotonically increasing, so it won’t ruin the order of the original sequence of numbers.
- That being said, an increase in X₁ will result in an increase in the log-odds ratio log(P{Y=1}/P{Y=0}) by amount b > 0, which will increase the odds ratio itself (since the log is a monotonically increasing function), and this means that P{Y=1} get a bigger proportion of the 100% probability pie.
- In other words, if we increase X₁, the odds of Y=1 against Y=0 will increase, resulting in Y=1 being more likely than it was before the increase.
- The interpretation is similar when b < 0.
- I’ll leave it up to you to interpret this, to make sure you fully understand this game of numbers.
(4) Example Of Coefficients Interpretation.
- The probability of passing a math exam:

- In the model above, b = 0.13, c = 0.97, and p = P{Y=1} is the probability of passing a math exam.
- Let’s pick study_hours and see how it impacts the chances of passing the exam.
- Increasing the study hours by 1 unit (1 hour) will result in a 0.13 increase in logit(p) or log(p/1-p).
- Now, if log(p/1–p) increases by 0.13, that means that p/(1 — p) will increase by exp(0.13) = 1.14. This is a 14% increase in the odds of passing the exam (assuming that the variable female remains fixed).
- Let’s also interpret the impact of being a female on passing the exam. We know that exp(0.97) = 2.64.
- That being said, the odds of passing the exam are 164% higher for women.
Conclusion:
- The logistic regression coefficient β associated with a predictor X is the expected change in log odds of having the outcome per unit change in X.
- So increasing the predictor by 1 unit (or going from 1 level to the next) multiplies the odds of having the outcome by eβ.
(5) From Log-Odds To Probability.
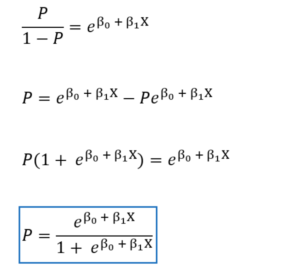
Because the concept of odds and log odds is difficult to understand, we can solve for P to find the relationship between the probability of having the outcome and the intercept β0.
To solve for the probability P, we exponentiate both sides of the equation above to get:
(6) Interpreting Coefficients
Because the concept of odds and log odds is difficult to understand, we can solve for P to find the relationship between the probability of having the outcome and the intercept β0.
To solve for the probability P, we exponentiate both sides of the equation above to get:
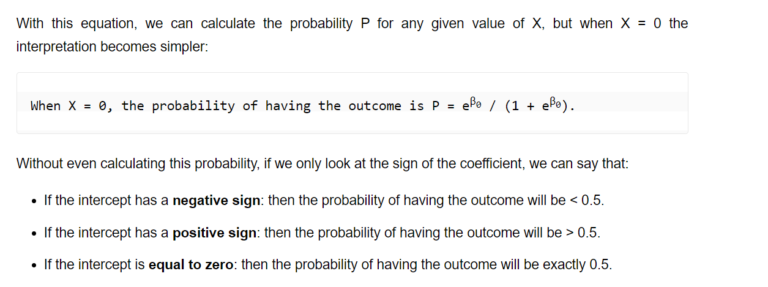
Sign Of The Coefficients: The sign (positive or negative) of the coefficient indicates the direction of the relationship between the predictor variable and the log-odds of the outcome variable. A positive coefficient suggests that an increase in the predictor variable is associated with an increase in the log odds (and thus the probability) of the outcome variable, while a negative coefficient suggests the opposite.
Magnitude Of The Coefficients: The magnitude of the coefficients reflects the strength of the relationship between the predictor variable and the log-odds of the outcome. Larger coefficient values indicate a stronger influence of the predictor on the log-odds and probability of the outcome variable.
Odds Ratio Interpretation: To provide a more intuitive interpretation, the coefficients in logistic regression are often exponentiated to obtain the odds ratios. The odds ratio represents the multiplicative change in the odds of the outcome variable for a one-unit increase in the predictor variable while holding other predictors constant. For example, an odds ratio of 1.5 indicates that a one-unit increase in the predictor variable is associated with a 50% increase in the odds of the outcome variable.
Confidence Intervals: It is important to consider the confidence intervals for the coefficients. These intervals provide a range of plausible values for the coefficient estimate. If the confidence interval includes 0, it suggests that the coefficient is not statistically significant and the predictor may not have a meaningful impact on the outcome variable.
Control For Other Variables: When interpreting the coefficients, it is crucial to consider the model’s other predictor variables. The coefficients represent the relationship between a specific predictor and the outcome variable while assuming that the other predictors are held constant. Changes in the coefficients may occur when other predictors are included or excluded from the model.
Assumptions And Limitations: The interpretation of logistic regression coefficients assumes linearity and additivity between the predictors and the log-odds of the outcome. Non-linear relationships may require transformations or more complex modelling techniques. Additionally, the interpretation relies on the assumption of no multicollinearity between the predictors.
Overall, the interpretation of logistic regression coefficients involves understanding the direction, magnitude, and odds ratio associated with each predictor variable. It is essential to consider the context of the study, the statistical significance, and the control of other predictors to derive meaningful interpretations from the coefficients.
(7) Examples Of Interpreting Coefficients
- The logistic regression coefficient β associated with a predictor X is the expected change in log odds of having the outcome per unit change in X.
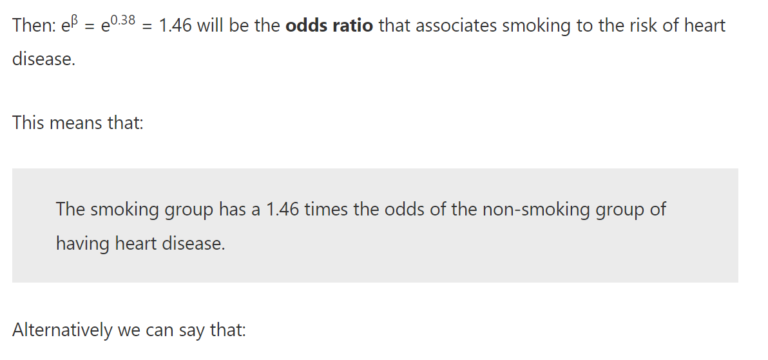
- So increasing the predictor by 1 unit (or going from 1 level to the next) multiplies the odds of having the outcome by eβ.
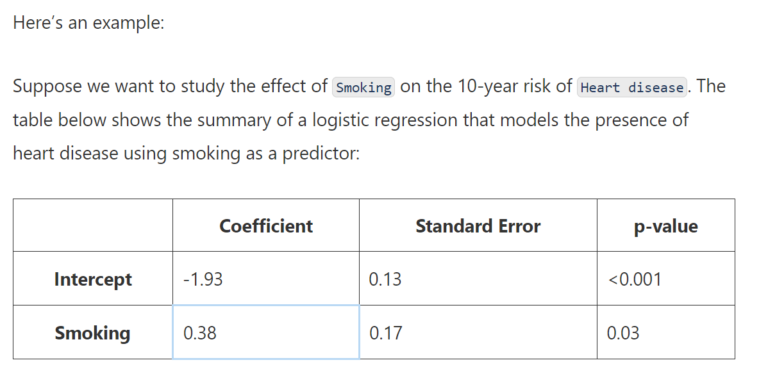
The question is: How to interpret the coefficient of smoking: β = 0.38?
First notice that this coefficient is statistically significant (associated with a p-value < 0.05), so our model suggests that smoking does in fact influence the 10-year risk of heart disease.
And because it is a positive number, we can say that smoking increases the risk of having a heart disease.
But by how much?
If smoking is a binary variable (0: non-smoker, 1: smoker):
For Positive Coefficients:


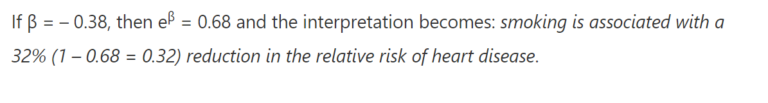
Note for negative coefficients:
(8) Interpreting Standard Error:
- The standard error is a measure of uncertainty of the logistic regression coefficient.
- It is useful for calculating the p-value and the confidence interval for the corresponding coefficient.
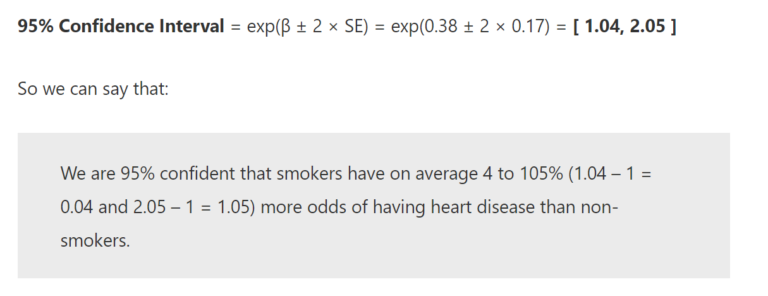
From the table above, we have: SE = 0.17.
We can calculate the 95% confidence interval using the following formula:
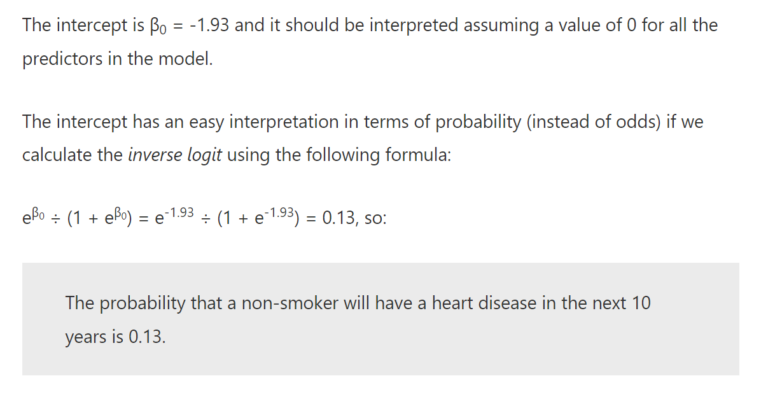
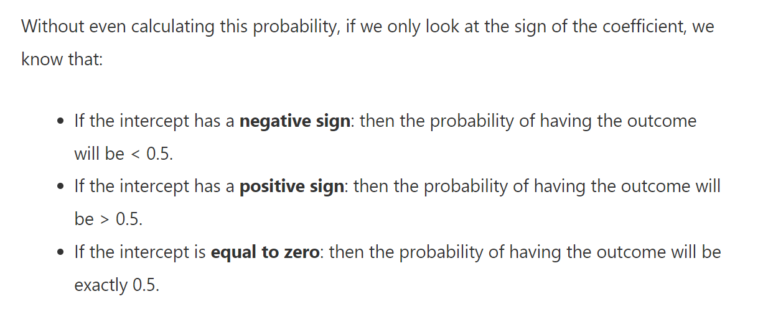
(9) How To Interpret Intercept?
(10) Odd Ratio Interpretation
- An RR (or OR) of 1.0 indicates that there is no difference in risk (or odds) between the groups being compared.
- An RR (or OR) more than 1.0 indicates an increase in risk (or odds) among the exposed compared to the unexposed.
- whereas a RR (or OR) <1.0 indicates a decrease in risk (or odds) in the exposed group.
(11) More Reading Links.
https://kids.frontiersin.org/articles/10.3389/frym.2022.926624#:~:text=Probability%20and%20Odds,-To%20understand%20the&text=Recall%20that%20a%20probability%20of,not%20occurring%20(Figure%201)