K – Means Clustering
Table Of Contents:
- What Is Clustering?
- What Is The K-Means Algorithm?
- How Does The K-Means Algorithm Work?
- How to Choose the Right Number of Clusters in K-Means Clustering?
- Advantages & Disadvantages Of K-Means Clustering.
- Applications Of K-Means Clustering.
(1) What Is Clustering ?
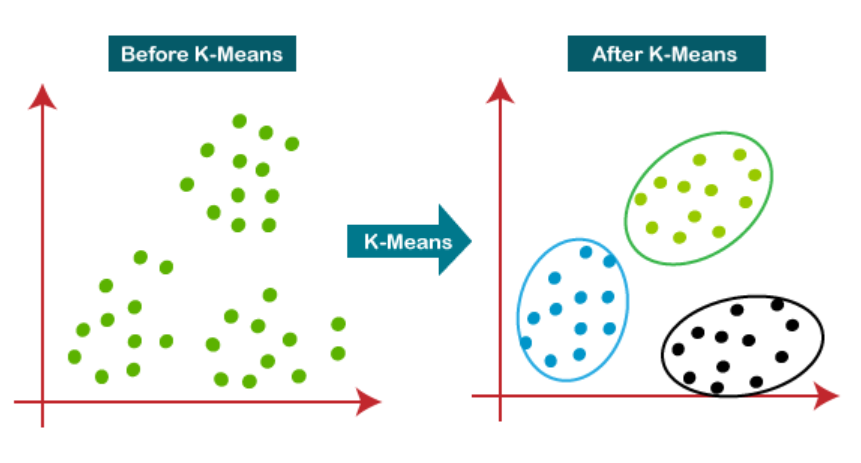
- Clustering is a technique used in machine learning and data analysis to group similar objects or data points together based on their inherent characteristics or patterns. It is an unsupervised learning method, meaning that it does not rely on labelled data or predefined categories.
- The goal of clustering is to identify natural groupings within a dataset, where objects within the same group are more similar to each other compared to those in other groups. These groups are often referred to as clusters.

How Clustering Algorithm Works:
Clustering algorithms examine the features or attributes of the data points and measure the similarity or dissimilarity between them. Commonly used distance metrics include Euclidean distance, Manhattan distance, or cosine similarity. The choice of distance metric depends on the nature of the data and the problem being solved.
Different Clustering Algorithm:
- k-means clustering,
- hierarchical clustering,
- DBSCAN (Density-Based Spatial Clustering of Applications with Noise)
- Gaussian mixture models.
Application Of Clustering:
- Customer segmentation for targeted marketing,
- Image and text categorization,
- Anomaly detection,
- Recommendation systems
- And many other areas where grouping similar data points is useful for analysis or decision-making.
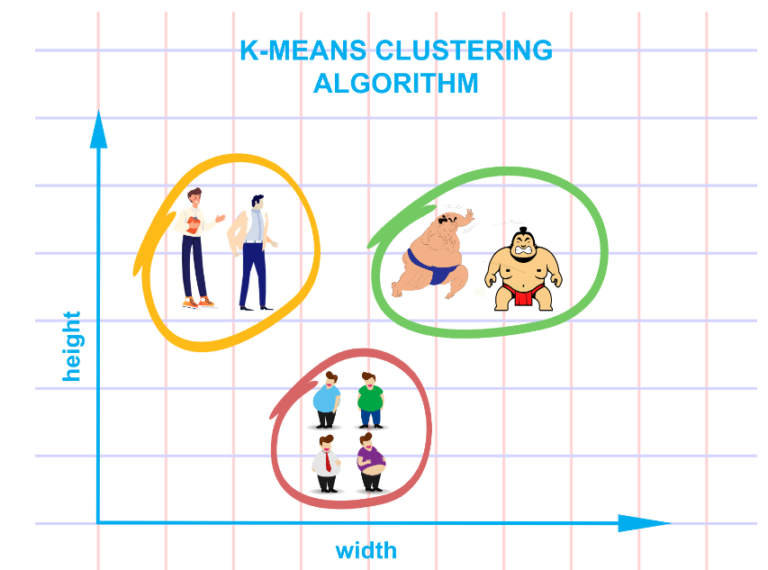
(2) What Is K-Means Clustering Algorithm?
- K-Means Clustering is an Unsupervised Learning algorithm, which groups the unlabeled dataset into different clusters.
- Here K defines the number of pre-defined clusters that need to be created in the process, if K=2, there will be two clusters, and for K=3, there will be three clusters, and so on.
- It is a centroid-based algorithm, where each cluster is associated with a centroid.
- The objective of k-means clustering is to minimize the within-cluster sum of squares, which represents the squared distances between data points and their assigned centroids. By minimizing this measure, the algorithm aims to create compact and well-separated clusters.
- It’s important to note that k-means clustering is sensitive to the initial placement of centroids, and different initializations can lead to different clustering results. To mitigate this issue, multiple runs of the algorithm with different initializations are often performed, and the solution with the lowest within-cluster sum of squares is selected.
(3) How Does K-Means Clustering Algorithm Works ?
(1) Choosing The Number Of Clusters
- The first step is to define the K number of clusters in which we will group the data. Let’s select K=3.
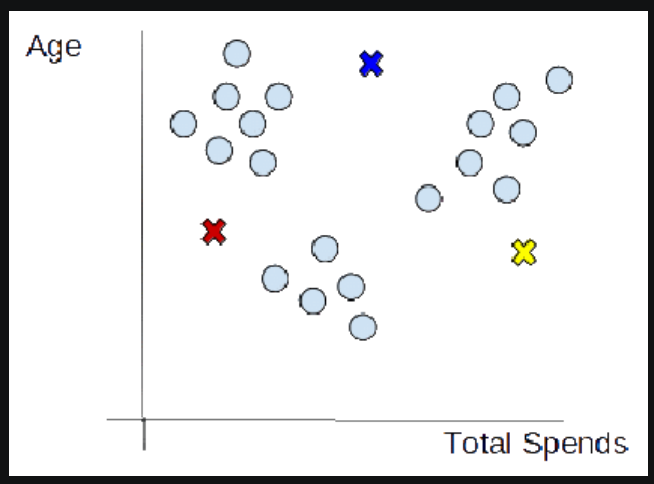
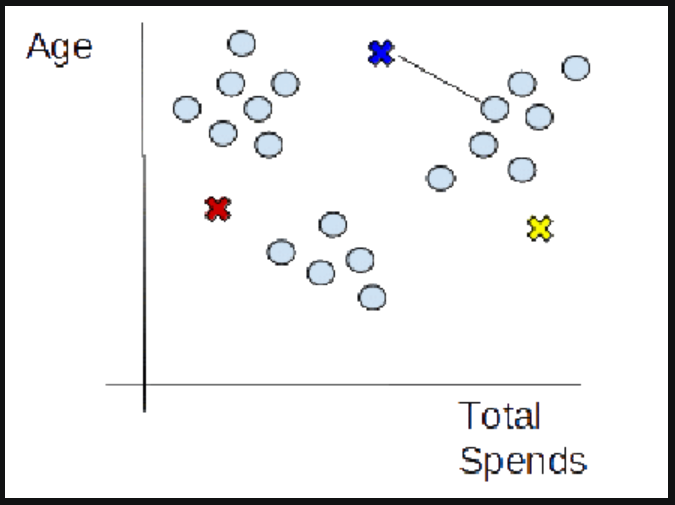
(2) Initializing Centroids
- The centroid is the centre of a cluster but initially, the exact centre of data points will be unknown so, we select random data points and define them as centroids for each cluster. We will initialize 3 centroids in the dataset.
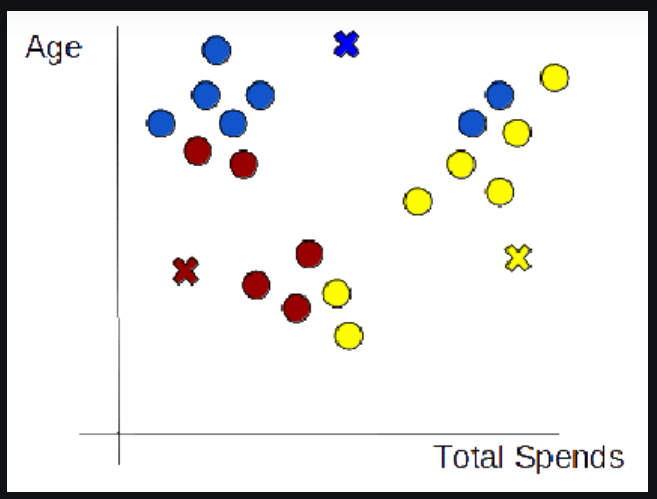
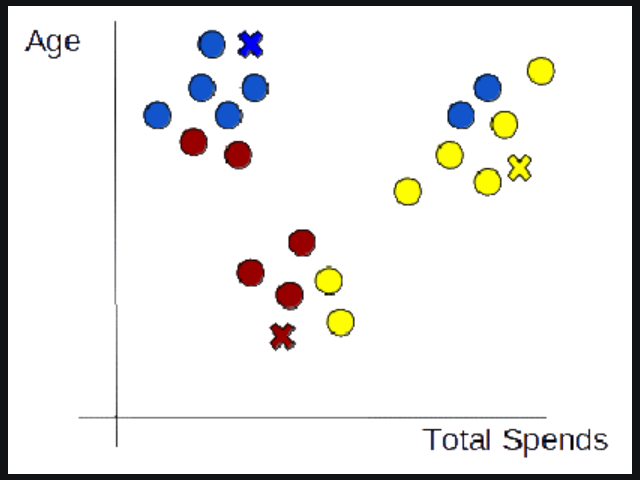
(3) Assign Data Points To The Nearest Cluster
- Now that centroids are initialized, the next step is to assign data points Xn to their closest cluster centroid Ck
- In this step, we will first calculate the distance between data point X and centroid C using the Euclidean Distance metric.
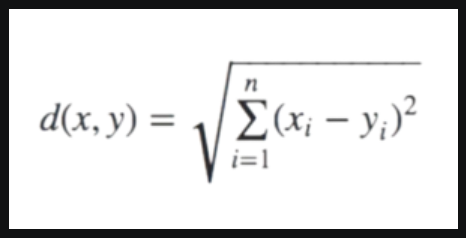
- And then choose the cluster for data points where the distance between the data point and the centroid is minimum.
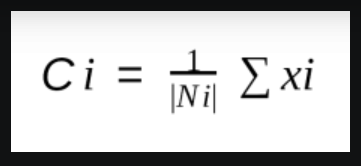
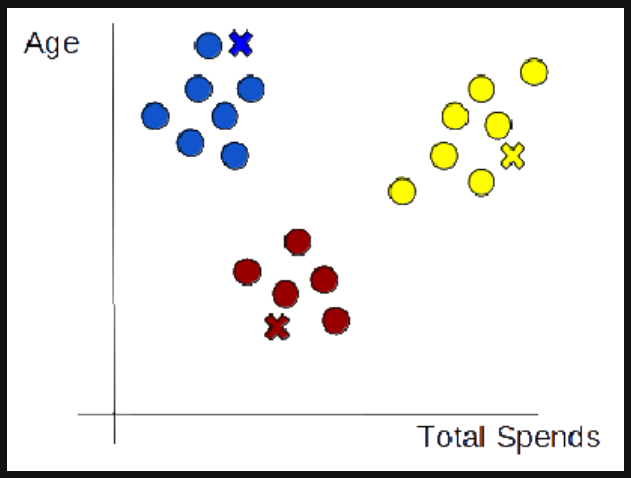
(4) Re-Initialize Centroids
- Next, we will re-initialize the centroids by calculating the average of all data points of that cluster.
(5) Repeat steps 3 and 4
- We will keep repeating steps 3 and 4 until we have optimal centroids and the assignments of data points to correct clusters are not changing anymore.
Super Note:
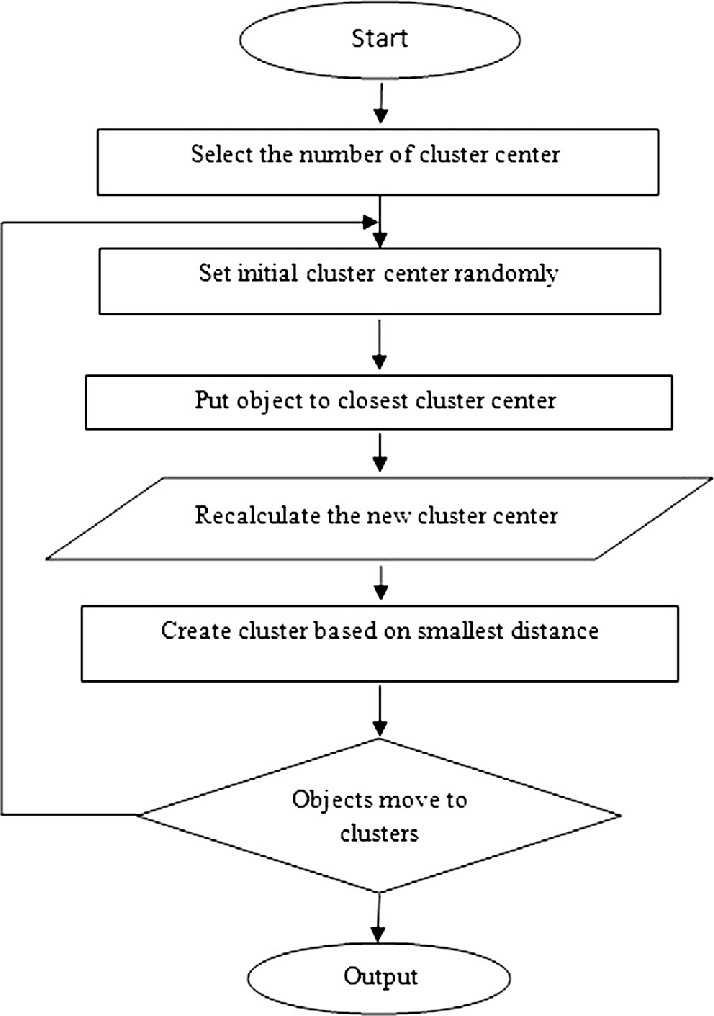
- Step-1: Choose the number of clusters you want for your dataset. This will be the value of ‘K’. As Data Scientists, we have to choose the value of ‘K’. The model can’t find the value itself. These points will be called centroids.
- Step-2: Assign each data point to its nearest centroid. For that, we need to calculate the Euclidean Distance between each data point and all the centroids. Data points close to the centroid will be assigned to that centroid. In this step, we will create our initial clusters.
- Step-3: Take the mean of the data points from each cluster. The mean value will be our new centroid points.
- Step-4: Calculate the Euclidean Distance between every data point to the new centroid points. Assign the data points which are close to the new centroid points. In this step, we will have clusters with different data points in it.
- Step-5: As we have new data points in the clusters, we have to again take the mean of the data points inside each cluster. The new mean will be our new centroid points.
- Step-6: As the centroid points have moved we have to again calculate the Euclidean Distance between every data point to the new centroid points. We have to reassign the data points to the new centroid points.
- Step-7: If the centroid points do not move after taking the mean of all values inside the clusters, we have to stop there. Because there are no new data points assigned to the cluster.
(4) How to Choose the Right Number of Clusters in K-Means Clustering?
- Choosing the value of k, the number of clusters, in k-means clustering can be determined through various methods.
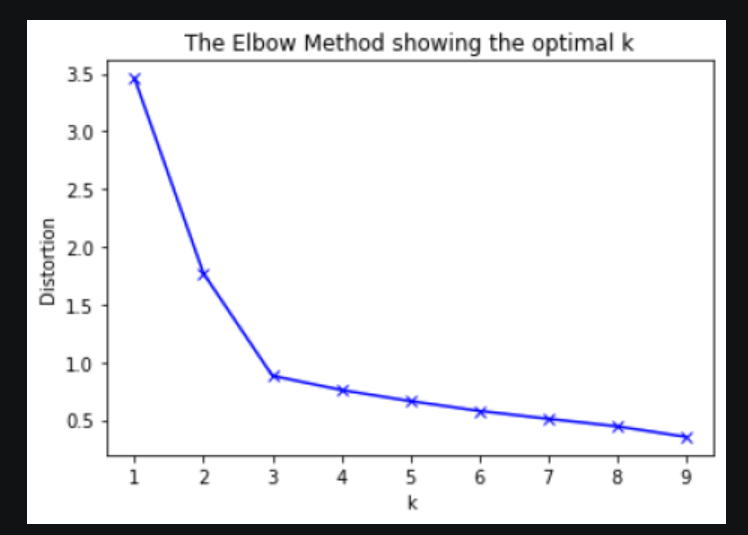
Elbow Method:
- Plot the within-cluster sum of squares (WCSS) or distortion as a function of the number of clusters.
- WCSS represents the sum of squared distances between data points and their assigned centroids.
- The plot will typically show a decreasing trend as k increases.
- The “elbow” of the plot, where the rate of decrease significantly slows down, can be considered as a good choice for k.
How Elbow Method Works?
Apply the k-means clustering algorithm to your dataset for a range of k values, typically from 1 to a maximum number of clusters you want to consider.
For each value of k, calculate the WCSS or distortion, which represents the sum of squared distances between data points and their assigned centroids within each cluster.
Plot the k values on the x-axis and the corresponding WCSS or distortion values on the y-axis.
Examine the plot and look for the “elbow” point, which is the value of k where the decrease in WCSS or distortion starts to level off or slows down significantly.
Conclusion:
The intuition behind the elbow method is that as the number of clusters increases, the WCSS or distortion tends to decrease because each data point can be assigned to a closer centroid.
However, beyond a certain number of clusters, the decrease in WCSS or distortion becomes less significant, resulting in a more gradual slope on the plot. The elbow point represents a trade-off between a low WCSS or distortion and a simpler, more interpretable solution.
Ideally, the elbow point should be selected as the optimal number of clusters. However, in practice, the plot may not always exhibit a clear elbow shape, making it subjective to determine the exact value of k. In such cases, it’s recommended to consider other methods and domain knowledge to make a more informed decision.
(5) Advantages Or Disadvantages Of K-Means Clustering?
Advantages:
Simplicity and Efficiency: K-means clustering is relatively simple to understand and implement. It is computationally efficient and can handle large datasets with a linear time complexity.
Scalability: K-means clustering can scale well to a large number of data points and dimensions, making it suitable for high-dimensional datasets.
Interpretability: The resulting clusters in k-means clustering are easy to interpret since each data point is assigned to a single cluster. The centroids of the clusters provide meaningful summaries of the cluster characteristics.
Versatility: K-means clustering can be applied to a wide range of data types and is not limited to specific domain requirements. It is a general-purpose clustering algorithm.
Disadvantages:
Sensitive to Initial Centroid Placement: The choice of initial centroids can impact the final clustering result. Different initializations may lead to different solutions, and the algorithm may converge to suboptimal clusters.
Assumes Spherical Clusters and Equal Sizes: K-means clustering assumes that clusters are spherical and have similar sizes. This assumption may not hold for complex or irregularly shaped clusters or clusters with varying densities.
Requires Predefined Number of Clusters: The number of clusters, k, needs to be specified in advance, which may be challenging and subjective. Choosing an inappropriate value for k can result in poor clustering results.
Outliers and Noise Sensitivity: K-means clustering is sensitive to outliers and noise. Outliers can significantly affect the position of centroids and distort the clustering results.
Lack of Robustness to Different Data Distributions: K-means clustering assumes that clusters have similar densities, but it may struggle with datasets containing clusters of different densities or non-linearly separable clusters.
(6) Applications Of K-Means Clustering?
Customer Segmentation: K-means clustering can be used to segment customers based on their behaviours, preferences, or demographic data. This information can be leveraged for targeted marketing, personalized recommendations, and customer relationship management.
Image Compression: K-means clustering can be applied to compress images by clustering similar colours together. By reducing the number of colours used in an image, it can be represented more efficiently, leading to reduced storage space and faster image processing.
Anomaly Detection: K-means clustering can be used to identify anomalies or outliers in a dataset. Data points that do not fit well into any cluster or are significantly distant from their assigned centroid can be considered as potential anomalies.
Document Clustering: K-means clustering can cluster documents based on their content or similarity. This can be useful for organizing large document collections, topic modelling, or information retrieval.
Market Segmentation: K-means clustering can segment markets based on consumer preferences, purchasing patterns, or demographic information. This information can aid in understanding market dynamics, targeting specific market segments, and developing tailored marketing strategies.
Image Segmentation: K-means clustering can be used to segment an image into distinct regions based on pixel similarity. This technique is often employed in computer vision tasks such as object recognition, image editing, and medical image analysis.
Recommendation Systems: K-means clustering can be utilized in recommendation systems to group similar users or items. By clustering users with similar preferences or items with similar characteristics, personalized recommendations can be generated.
Natural Language Processing (NLP): In NLP, k-means clustering can be employed for text categorization, topic modelling, or sentiment analysis. It can help identify groups of documents or phrases that share similar semantic or syntactic properties.