K – Nearest Neighbors
Table Of Contents:
- What Is K – Nearest Neighbor Algorithm?
- How Does The KNN Algorithm Work?
- How Do We Choose The Factore K?
- Distance Metrics Used In KNN Algorithm.
- Advantages & Disadvantages Of KNN Algorithm.
- Applications Of KNN Algorithm.
(1) What Is K – Nearest Neighbor?
- The k-nearest neighbours (k-NN) algorithm is a popular supervised machine learning algorithm used for both classification and regression tasks.
- It operates based on the principle that data points with similar features tend to belong to the same class or have similar output values.
- It is widely disposable in real-life scenarios since it is non-parametric, meaning, it does not make any underlying assumptions about the distribution of data.
- It is also called a lazy learner algorithm because it does not learn from the training set immediately instead it stores the dataset and at the time of classification, it performs an action on the dataset.

(2) How Does KNN Works?
Training Phase:
- During the training phase, the algorithm simply stores the feature values and corresponding class labels or output values of the training data points.
Prediction Phase:
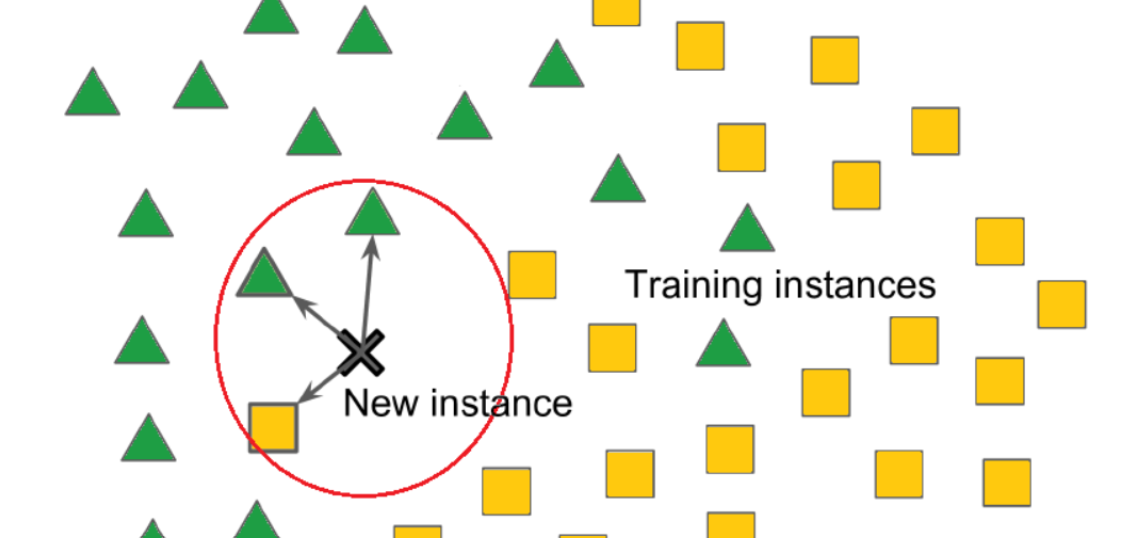
- Given a new, unlabeled data point for which we want to make a prediction, the algorithm finds the k nearest neighbors to that data point from the training data based on a distance metric (e.g., Euclidean distance).
Classification Task:
- It will first calculate the distance from all data points to the new unlabeled point.
- It will sort the distances in ascending order.
- Based on the value of ‘K’ it will choose the top ‘K’ points from the sorted list.
- It will do the max voting out of ‘K’ number of votes.
- The class which have maximum number of votes will be labeled for new data points.
- For a classification task, the algorithm assigns the class label to the new data point based on the majority class among its k nearest neighbors. This is done by counting the occurrences of each class among the neighbors and selecting the class with the highest count.
Regression Task:
- For a regression task, the algorithm predicts the output value for the new data point by taking the average or weighted average of the output values of its k nearest neighbors.
(3) Example Of K – Nearest Neighbors.
- Suppose we have a new data point and we need to put it in the required category. Consider the below image:
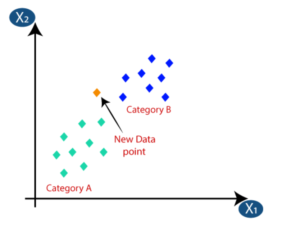
- Firstly, we will choose the number of neighbors, so we will choose the k=5.
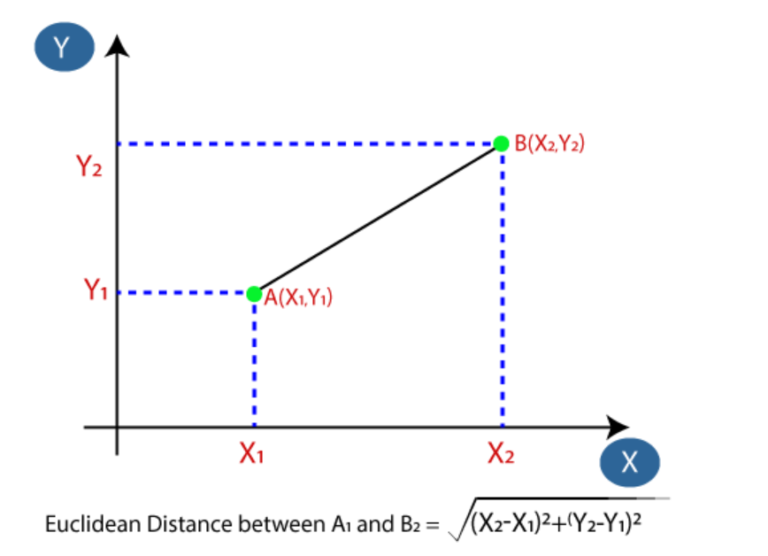
- Next, we will calculate the Euclidean distance between the data points. The Euclidean distance is the distance between two points, which we have already studied in geometry. It can be calculated as:
- By calculating the Euclidean distance we got the nearest neighbors, as three nearest neighbors in category A and two nearest neighbors in category B. Consider the below image:
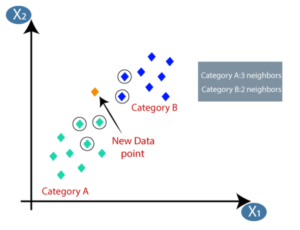
- As we can see the 3 nearest neighbors are from category A, hence this new data point must belong to category A.
(4) How To Choose Correct Value Of ‘K’.
- There is no particular way to determine the best value for “K”, so we need to try some values to find the best out of them. The most preferred value for K is 5.
- A very low value for K such as K=1 or K=2, can be noisy and lead to the effects of outliers in the model.
- Large values for K are good, but it may find some difficulties.
Guidelines:
Domain Knowledge: Consider your domain knowledge and understanding of the problem. Some domains may have inherent characteristics that suggest an appropriate range for k. For example, if you’re working with image classification, you might know that neighboring pixels have a strong influence and could start with smaller values of k.
Odd vs. Even k: It’s generally recommended to use an odd value for k to avoid ties when determining the class label of a data point. Ties can occur when there’s an equal number of nearest neighbors from different classes, making it difficult to assign a definitive class label.
Cross-Validation: Utilize cross-validation techniques, such as k-fold cross-validation, to evaluate different values of k. Split your data into training and validation sets, then train your KNN model with various values of k on the training set and measure its performance on the validation set. Choose the value of k that provides the best performance metrics (e.g., accuracy, precision, recall) on the validation set.
Grid Search: Perform a grid search to systematically try out different values of k and evaluate the model’s performance using a specific metric. This involves defining a range of potential k values and evaluating each value using a validation set or cross-validation. The value of k that yields the best performance metric can be selected as the optimal k value.
Rule of Thumb: As a starting point, you can use the square root of the total number of data points as a rough estimate for k. However, this rule may not always be the best choice, so it’s important to validate and fine-tune the value using the methods mentioned above.
(5) Distance Metrics Used In KNN Algorithm.
- to determine the closest groups or the nearest points for a query point we need some metric. For this purpose, we use below distance metrics:
- Euclidean Distance
- Manhattan Distance
- Minkowski Distance
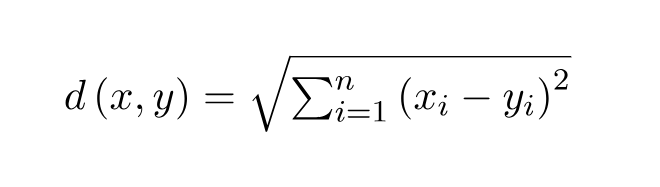
Euclidean Distance:
- Euclidean Distance represents the shortest distance between two points.
- Euclidean distance is a measure of the straight-line distance between two points in Euclidean space.
- Euclidean distance can also be visualized as the length of the straight line that joins the two points which are into consideration.
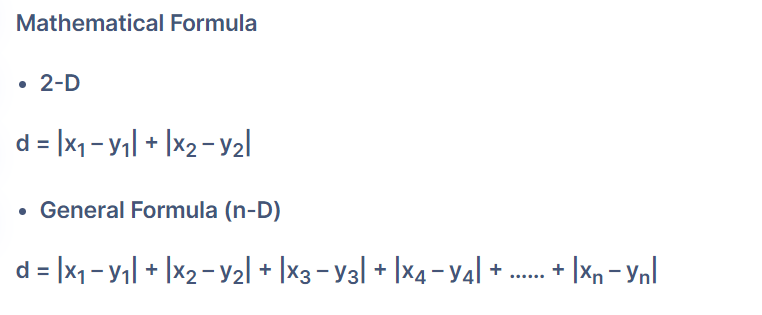
Manhattan Distance:
- Manhattan distance, also known as city block distance or L1 distance, is a measure of the distance between two points in a grid-like or Cartesian space.
- It is named after the urban grid layout of Manhattan, where the distance between two points is calculated by the sum of the absolute differences in their coordinates.

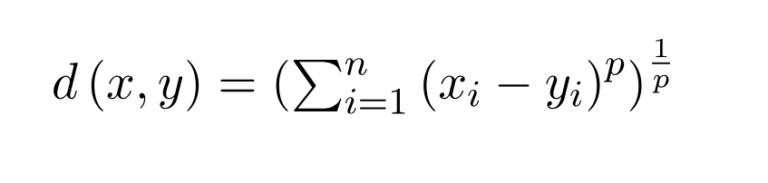
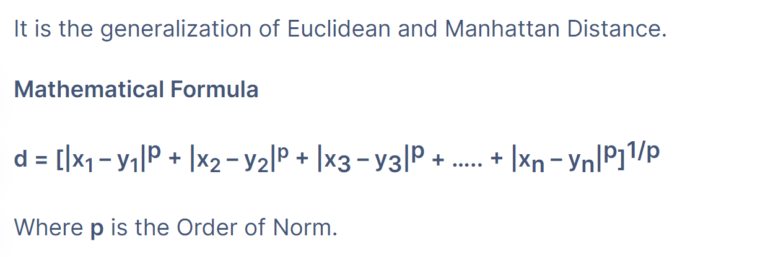
Minkowski Distance:
- The Minkowski distance is a generalization of both the Euclidean distance and the Manhattan distance.
- It is a metric that measures the distance between two points in a multidimensional space and is defined by the parameter ‘p’.
- When ‘p’ equals 1, it is equivalent to the Manhattan distance, and when ‘p’ equals 2, it is equivalent to the Euclidean distance.
(6) Advantages & Disadvantages Of KNN Algorithm.
Advantages:
Simplicity: KNN is a straightforward and easy-to-understand algorithm. It can be implemented relatively quickly without making strong assumptions about the underlying data distribution.
No Training Phase: KNN is a lazy learning algorithm, meaning it does not require a training phase. Instead, it stores the entire training dataset and performs computations at runtime, making it efficient for incremental learning and dynamic datasets.
Versatility: KNN can be applied to both classification and regression problems. It can handle various types of data, including numerical, categorical, and binary variables.
Non-Parametric: KNN is a non-parametric algorithm, which means it does not assume any specific form or parameters for the underlying data distribution. It can adapt to complex relationships and patterns in the data.
Interpretable Results: KNN provides interpretability as it assigns class labels based on the majority votes of the nearest neighbours. This allows for easy understanding and explanation of the decision-making process.
Disadvantages:
Computationally Expensive: KNN can be computationally expensive, especially when dealing with large datasets, as it requires calculating distances between the query point and all training points. This can slow down the prediction phase, especially if the dataset has high dimensionality.
Sensitivity to Feature Scaling: KNN is sensitive to the scale of features. If the features have different scales, those with larger scales can dominate the distance calculation, leading to biased results. It is important to normalize or standardize the features before applying KNN.
Curse of Dimensionality: KNN performance can deteriorate in high-dimensional spaces. As the number of dimensions increases, the distance between neighbours becomes less meaningful, leading to increased sparsity and potential loss of predictive accuracy. Dimensionality reduction techniques may be necessary to mitigate this issue.
Imbalanced Data: KNN can struggle with imbalanced datasets, where one class heavily outweighs the others. The majority class can dominate the prediction, resulting in biased results. Techniques such as oversampling, undersampling, or using weighted distances can help address this problem.
Determining Optimal K: Choosing the appropriate value for K can be challenging. A low value of K may lead to overfitting and increased sensitivity to noise, while a high value of K may result in over-smoothing and loss of local patterns. It requires careful tuning and validation to find the optimal value of K for a specific problem.
(7) Applications Of Of KNN Algorithm.
Healthcare: KNN can be used in medical diagnostics to classify patients based on their symptoms, medical history, or genetic information. By comparing a patient’s characteristics with those of similar patients in the dataset, KNN can help in disease diagnosis, prediction of treatment outcomes, and personalized medicine.
Customer Segmentation: KNN can be applied in marketing and customer analytics to segment customers based on their preferences, behaviours, or demographic data. By considering the nearest neighbours of a customer, businesses can target specific customer segments with personalized marketing strategies.
Fraud Detection: KNN can be used for fraud detection in financial transactions. By analyzing the similarities between a transaction and previous fraudulent transactions, KNN can identify potentially fraudulent activities and trigger an alert for further investigation.
Document Classification: KNN can be employed in text mining and natural language processing tasks, such as document classification. By comparing the text features of a document with those of similar documents in the dataset, KNN can classify it into categories like spam detection, sentiment analysis, or topic classification.
Image Recognition: KNN can be utilized in image recognition tasks, such as face recognition or object recognition. By comparing the features of an image with those of similar images in a database, KNN can identify the corresponding person or object.
Recommender Systems: KNN-based recommender systems can suggest products, movies, or songs based on the preferences and ratings of similar users. By finding the nearest neighbours of a user, KNN can recommend items that are popular among similar users.
Traffic Analysis: KNN can be applied in traffic analysis to predict traffic congestion or estimate travel times. By considering the historical traffic patterns and characteristics of neighbouring road segments, KNN can make predictions and assist in route planning or traffic management.
Environmental Monitoring: KNN can be used for monitoring air quality, water quality, or ecological conditions. By comparing the sensor readings of a particular location with those of nearby locations, KNN can detect anomalies, identify pollution sources, or predict environmental changes.