Pearson Correlation Coefficient
Table Of Contents:
- What Is Pearson Correlation Coefficient?
- Visualizing Pearson Correlation Coefficient.
- Formula For Pearson Coefficient.
- Example Of Pearson Coefficient.
- Difference In Correlation Coefficient and Regression Coefficient.
(1) What Is Pearson Correlation Coefficient?
- The Pearson Correlation Coefficient (r) is the most common way of measuring a linear correlation.
- It is a number between –1 and 1 that measures the strength and direction of the relationship between two variables.
- The sample correlation coefficient is denoted as r.

Super Note:
- The Pearson Coefficient can only tell you the is there any linear relationship between two variables or not.
- If the relationship exists what is the strength of the relationship?
- It will also tell you which direction the relationship is going.
- For the Linear Regression model, we have to check whether there exists a linear relationship between the dependent and independent variables.
- To check this relationship first we have to run Pearson’s r-coefficient test to check the relationship.
- If there exists a relationship we can consider that variable or else not.
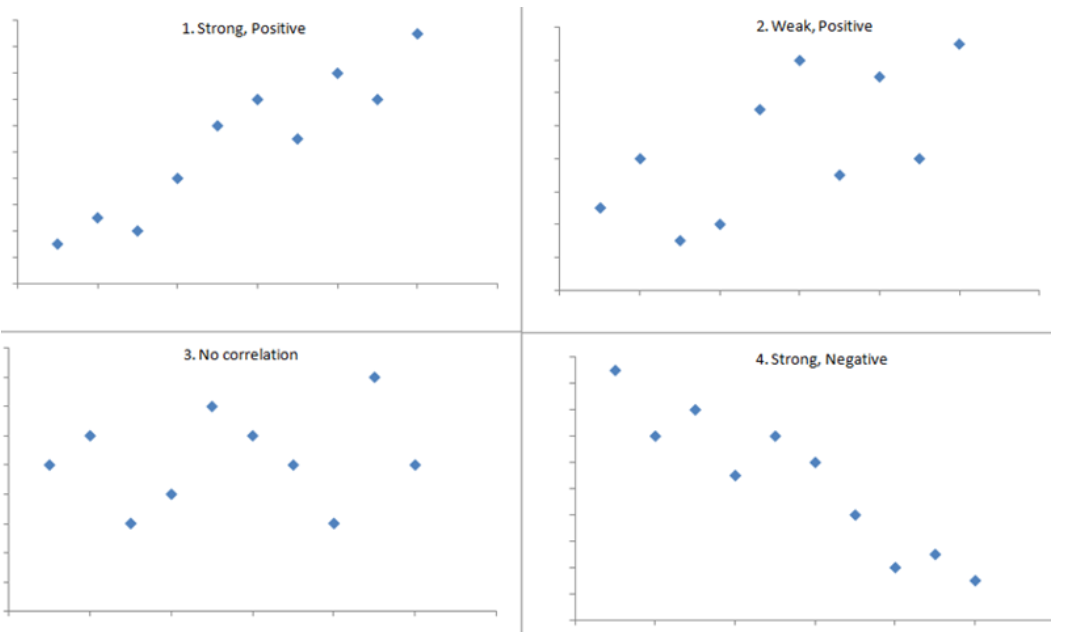
(2) Visualizing Pearson Correlation Coefficient.

- Scenario 1 depicts a strong positive association (r=0.9), similar to what we might see for the correlation between infant birth weight and birth length.
- Scenario 2 depicts a weaker association (r=0,2) that we might expect to see between age and body mass index (which tends to increase with age).
- Scenario 3 might depict the lack of association (r approximately = 0) between the extent of media exposure in adolescence and the age at which adolescents initiate sexual activity.
- Scenario 4 might depict the strong negative association (r= -0.9) generally observed between the number of hours of aerobic exercise per week and percent body fat.
(3) Formula For Pearson Correlation Coefficient.

- n is the sample size.
- x and y are the individual sample points.
(4) Examples Of Pearson Correlation Coefficient.
- Imagine that you’re studying the relationship between newborns’ weight and length.
- You have the weights and lengths of the 10 babies born last month at your local hospital.
- After you convert the imperial measurements to metric, you enter the data in a table:

Step 1: Calculate the sums of x and y
Start by renaming the variables to “x” and “y.” It doesn’t matter which variable is called x and which is called y—the formula will give the same answer either way.
Next, add up the values of x and y. (In the formula, this step is indicated by the Σ symbol, which means “take the sum of”.)

Step 2: Calculate x2 and y2 and their sums
- Create two new columns that contain the squares of x and y. Take the sums of the new columns.


Step 3: Calculate the cross product and its sum
- In a final column, multiply together x and y (this is called the cross product). Take the sum of the new column.


Step 4: Calculate r
- Use the formula and the numbers you calculated in the previous steps to find r.

(5) Difference In Correlation Coefficient and Regression Coefficient.
- Correlation Coefficient indicates the extent to which two variable move together.
- Regression indicates the impact of a change of unit on the estimated variable (y) in the known variable (x).
- Correlation is described as the analysis that allows us to know the relationship between two variables ‘x’ and ‘y’ or the absence of it.
- On the other hand, the Regression analysis predicts the value of the dependent variable based on the known value of the independent variable, assuming that there is an average mathematical relation between two or more variables.
- Correlation is when it is observed that a change in a unit in one variable is retaliated by an equivalent change in another variable, i.e., direct or indirect, at the time of study of two variables.
- Or else the variables are said to be uncorrelated when the motion in one variable does not amount to any movement in a specific direction in another variable.
- There is a relationship between the variables when it comes to correlation. In contrast, regression places emphasis on how one variable affects the other.
- Correlation does not capture causality whilst it is based on regression.
- The correlation between x and y is identical to that between y and x. Contrary to this, a regression of x and y, and y and x, results completely differently.
Super Note:
(6) If two variables are correlated are they causally related?
- It is a common error to confuse correlation and causation. All that correlation shows is that the two variables are associated.
- There may be a third variable, a confounding variable that is related to both of them.
- For example, monthly deaths by drowning and monthly sales of ice-cream are positively correlated, but no-one would say the relationship was causal!
- One of the most common errors in interpreting the correlation coefficient is failure to consider that there may be a third variable related to both of the variables being investigated, which is responsible for the apparent correlation.
Correlation does not imply causation. To strengthen the case for causality, consideration must be given to other possible underlying variables and to whether the relationship holds in other populations.
A nonlinear relationship may exist between two variables that would be inadequately described, or possibly even undetected, by the correlation coefficient.