What Is Likelihood In Statistics?
Table Of Contents:
- What Is Likelihood?
- What Is Likelihood Function?
(1) What Is Likelihood?
- Probability in statistics tells us about, what is the percentage of chance that the event is going to happen, give we should know the distribution of the data points, like normal distribution, exponential distribution etc.
- Likelihood in statistics tells us that, given all the data points we need to find out which distribution the data points are falling into. Here our main focus is to find out the distribution estimates like, the mean and standard deviation of the population.
- In Likelihood by seeing the data we need to find out from which distribution the data belongs to.
- Likelihood is used extensively in Machine Learning algorithms.
- In Machine Learning, we will have only the data points with us, from these data points we need to find out from which distribution it has come.
- For example in Linear Regression, we have to find out the beta parameters that will correctly represent the data points.
- Using Likelihood we can find out the correct parameters that will represent the data points.

(2) What Is Likelihood Function ?
- In statistics, the likelihood function is a fundamental concept used to estimate the parameters of a statistical model based on observed data.
- The likelihood function measures the probability of observing the given data for different values of the model parameters.
- By maximizing the likelihood function, we can find the parameter values that are most consistent with the observed data.
- The likelihood function expresses the possibility of measuring a certain data vector d for a given set of model parameters m and prior information I.
- Likelihood function quantifies how well a model F and the model parameter m can reproduced the measured/observed data d.
(3) Probability Density Function.
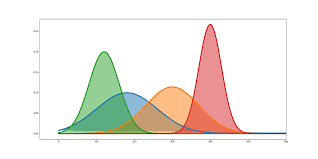
Probability density function (PDF)/Probability mass function (PMF): In statistical modeling, we often assume a probability distribution that characterizes the data.
For continuous variables, this is represented by a probability density function (PDF), while for discrete variables, it is represented by a probability mass function (PMF).
The PDF/PMF depends on the parameters of the distribution.
(4) Likelihood Function
- Given a set of observed data, the likelihood function is defined as the joint probability (or joint density) of the observed data, treated as a function of the unknown parameters.
- It represents how likely the observed data is for different values of the parameters.
- The likelihood function is denoted as L(θ | x), where θ represents the parameters and x represents the observed data.
- Overall, the likelihood function is a fundamental concept in statistical inference, providing a way to estimate the parameters of a model based on observed data.
- By maximizing the likelihood function, we can obtain parameter estimates that are most consistent with the observed data.
(5) Examples Of Likelihood Function
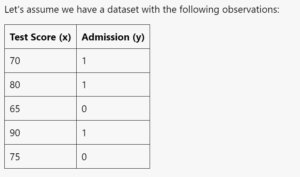
- Let’s consider a simple example of fitting a logistic regression model using the likelihood function.
- Suppose we have a binary classification problem where the dependent variable is whether a student is admitted to a university (1 for admitted, 0 for not admitted), and the independent variable is the student’s test score.
- We want to estimate the parameters of a logistic regression model to understand how the test score impacts the probability of admission.
- To estimate the parameters of the logistic regression model, we need to define the likelihood function.
- In logistic regression, the likelihood function is based on the assumption that the outcomes follow a Bernoulli distribution.
- Let’s denote the probability of admission given the test score as p(x), which is modelled using the logistic function. The logistic function transforms a linear combination of the parameters and the independent variable into a value between 0 and 1. The logistic function is defined as:
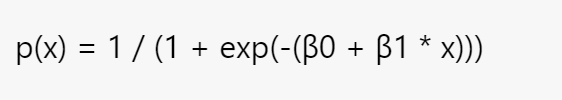
- Here, β0 and β1 are the parameters we want to estimate.
- The likelihood function is the product of the probabilities of each observation, assuming they are independent and follow a Bernoulli distribution.
- For each observation, the probability of admission (p(x)) is raised to the power of y (1 for admission, 0 for non-admission), and the probability of non-admission (1 – p(x)) is raised to the power of (1 – y). The likelihood function can be written as:

- To estimate the parameters, we seek the values of β0 and β1 that maximize the likelihood function. In practice, it is common to work with the log-likelihood function (log L(β0, β1)), as it simplifies calculations and allows for easier interpretation.
- By maximizing the log-likelihood function, we obtain the maximum likelihood estimates (MLE) of the parameters β0 and β1.
- Various optimization techniques, such as gradient descent or numerical optimization algorithms, can be used to find the MLE.
- Once we have the estimates for β0 and β1, we can interpret them to understand how the test score influences the probability of admission.
- For example, a positive β1 indicates that as the test score increases, the log-odds of admission (logit) increases, implying a higher probability of admission.
- This example demonstrates how the likelihood function is used in practice to estimate the parameters of a logistic regression model.
- By maximizing the likelihood, we find the parameter values that are most likely given the observed data, allowing us to understand the relationship between the independent variable and the probability of the binary outcome.
(5) Independent And Identically Distributed (i.i.d.) Assumption:
- The likelihood function assumes that the observed data points are independent and identically distributed.
- This means that the probability of observing each data point is assumed to be independent of the others and follows the same distribution.
(6) Maximum Likelihood Estimation (MLE):
- The main objective of the likelihood function is to find the parameter values that maximize the likelihood of observing the given data.
- This estimation technique is known as maximum likelihood estimation (MLE). In other words, MLE seeks to find the parameter values that make the observed data most likely.
(7) Log-Likelihood Function:
- In practice, it is often more convenient to work with the log-likelihood function, which is the natural logarithm of the likelihood function.
- Taking the logarithm simplifies calculations and allows for easier interpretation and numerical stability. The log-likelihood function is denoted as log L(θ | x).
(8)Estimating parameters:
- To estimate the parameters, we maximize the likelihood (or log-likelihood) function with respect to the parameters.
- This involves finding the values of the parameters that make the observed data most probable.
- Various optimization techniques, such as numerical optimization algorithms, can be used to find the maximum likelihood estimates.
(9) Properties Of Likelihood:
- The likelihood function has several desirable properties.
- When the sample size is large, the maximum likelihood estimates are asymptotically unbiased and efficient, meaning they converge to the true parameter values and have the smallest variance among consistent estimators.
- The likelihood ratio test is also a commonly used statistical test based on the likelihood function.