Pandas DataFrame Box Plot.
Table Of Contents:
- Syntax ‘plot.area( )’ Method In Pandas.
- Examples ‘plot.area( )’ Method.
(1) Syntax:
DataFrame.plot.box(by=None, **kwargs)Description:
- Make a box plot of the DataFrame columns.
- A box plot is a method for graphically depicting groups of numerical data through their quartiles.
- The box extends from the Q1 to Q3 quartile values of the data, with a line at the median (Q2). The whiskers extend from the edges of box to show the range of the data.
- The position of the whiskers is set by default to 1.5*IQR (IQR = Q3 – Q1) from the edges of the box. Outlier points are those past the end of the whiskers.
For further details see Wikipedia’s entry for boxplot.
A consideration when using this chart is that the box and the whiskers can overlap, which is very common when plotting small sets of data.
Parameters –
- by: str or sequence – Column in the DataFrame to group by.
- **kwargs – Additional keywords are documented in
DataFrame.plot().
Returns –
matplotlib.axes.Axesor numpy.ndarray of them
(2) Examples Of plot.box() Method:
Example-1:
import numpy as np
import pandas as pd
data = np.random.randn(25, 4)
df = pd.DataFrame(data, columns=list('ABCD'))
df
Output:

# Draw a box plot from a DataFrame with four columns of randomly generated data.
ax = df.plot.box()Output:

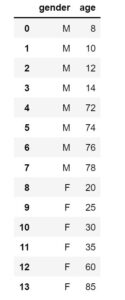
# You can also generate groupings if you specify the by parameter (which can take a column name, or a list or tuple of column names):
age_list = [8, 10, 12, 14, 72, 74, 76, 78, 20, 25, 30, 35, 60, 85]
df = pd.DataFrame({"gender": list("MMMMMMMMFFFFFF"), "age": age_list})
df
Output:

ax = df.plot.box(column="age", by="gender", figsize=(10, 8))Output:


