
Pandas DataFrame Area Plot.
Table Of Contents:
- Syntax ‘plot.boxplot( )’ Method In Pandas.
- Examples ‘plot.boxplot( )’ Method.
(1) Syntax:
DataFrame.boxplot(column=None, by=None, ax=None, fontsize=None, rot=0, grid=True,
                  figsize=None, layout=None, return_type=None, backend=None, **kwargs)
Description:
Make a box plot from DataFrame columns.
Make a box-and-whisker plot from DataFrame columns, optionally grouped by some other columns. A box plot is a method for graphically depicting groups of numerical data through their quartiles.
The box extends from the Q1 to Q3 quartile values of the data, with a line at the median (Q2). The whiskers extend from the edges of box to show the range of the data. By default, they extend no more than 1.5 * IQR (IQR = Q3 – Q1) from the edges of the box, ending at the farthest data point within that interval. Outliers are plotted as separate dots.
Parameters:
- column: str or list of str, optional – Column name or list of names, or vector. Can be any valid input to
pandas.DataFrame.groupby(). by: str or array-like, optional – Column in the DataFrame to
pandas.DataFrame.groupby(). One box-plot will be done per value of columns in by.ax: object of class matplotlib.axes.Axes, optional – The matplotlib axes to be used by boxplot.
fontsize: float or str – Tick label font size in points or as a string (e.g., large).
rot: int or float, default 0 – The rotation angle of labels (in degrees) with respect to the screen coordinate system.
grid: bool, default True – Setting this to True will show the grid.
figsize: A tuple (width, height) in inches – The size of the figure to create in matplotlib.
layout: tuple (rows, columns), optional – For example, (3, 5) will display the subplots using 3 columns and 5 rows, starting from the top-left.
return_type: {‘axes’, ‘dict’, ‘both’} or None, default ‘axes’ –
The kind of object to return. The default is
axes.‘axes’ returns the matplotlib axes the boxplot is drawn on.
‘dict’ returns a dictionary whose values are the matplotlib Lines of the boxplot.
‘both’ returns a namedtuple with the axes and dict.
when grouping with
by, a Series mapping columns toreturn_typeis returned.If
return_typeis None, a NumPy array of axes with the same shape aslayoutis returned.
- backend: str, default None –
Backend to use instead of the backend specified in the option
plotting.backend. For instance, ‘matplotlib’. Alternatively, to specify theplotting.backendfor the whole session, setpd.options.plotting.backend. - **kwargs – All other plotting keyword arguments to be passed to
matplotlib.pyplot.boxplot().
(2) Examples Of plot.area() Method:
Example-1:
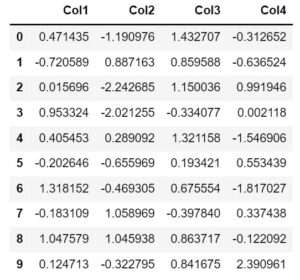
np.random.seed(1234)
df = pd.DataFrame(np.random.randn(10, 4),
                  columns=['Col1', 'Col2', 'Col3', 'Col4'])
df
Output:
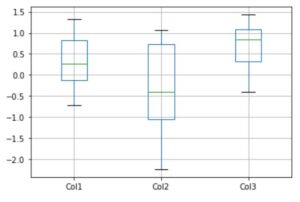
boxplot = df.boxplot(column=['Col1', 'Col2', 'Col3'])Output:
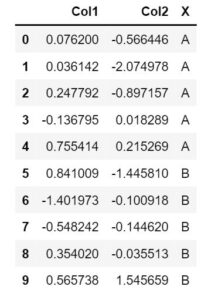
# Boxplots of variables distributions grouped by the values of a third variable can be created using the option by. For instance:
df = pd.DataFrame(np.random.randn(10, 2),
                  columns=['Col1', 'Col2'])
df['X'] = pd.Series(['A', 'A', 'A', 'A', 'A',
                     'B', 'B', 'B', 'B', 'B'])
df
Output:
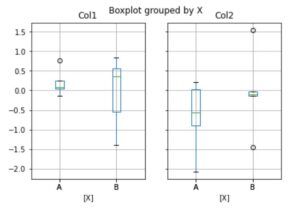
boxplot = df.boxplot(by='X')Output:
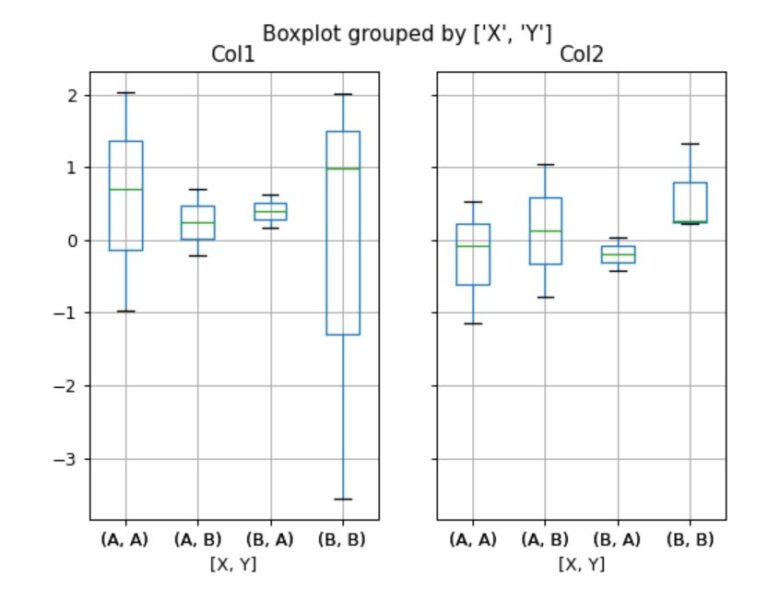
# A list of strings (i.e. [‘X’, ‘Y’]) can be passed to boxplot in order to group the data by combination of the variables in the x-axis:
df = pd.DataFrame(np.random.randn(10, 3),
                  columns=['Col1', 'Col2', 'Col3'])
df['X'] = pd.Series(['A', 'A', 'A', 'A', 'A',
                     'B', 'B', 'B', 'B', 'B'])
df['Y'] = pd.Series(['A', 'B', 'A', 'B', 'A',
                     'B', 'A', 'B', 'A', 'B'])
df
Output:
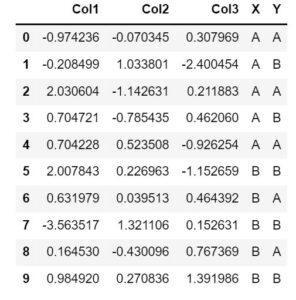
boxplot = df.boxplot(column=['Col1', 'Col2'], by=['X', 'Y'])Output:
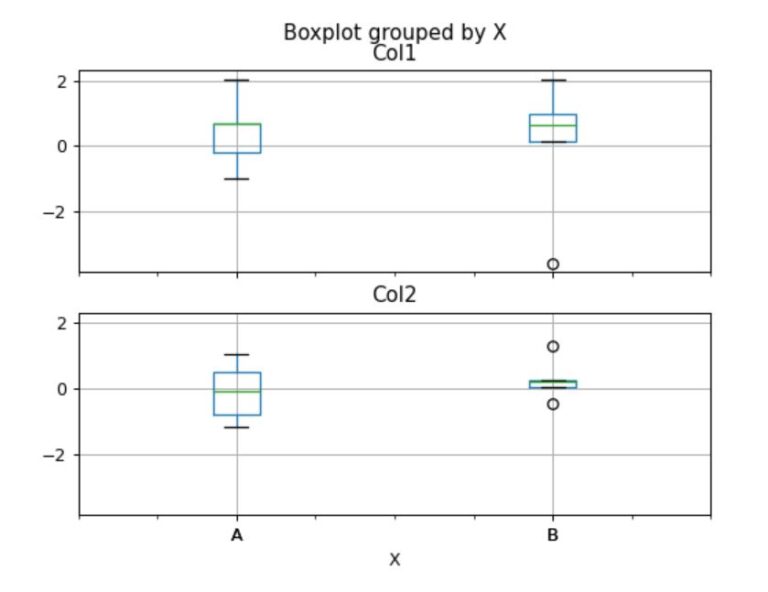
# The layout of boxplot can be adjusted giving a tuple to layout:
boxplot = df.boxplot(column=['Col1', 'Col2'], by='X',
                     layout=(2, 1))
Output:
# Additional formatting can be done to the boxplot, like suppressing the grid (grid=False), rotating the labels in the x-axis (i.e. rot=45) or changing the fontsize (i.e. fontsize=15):
boxplot = df.boxplot(grid=False, rot=45, fontsize=15) Output:
