Pandas DataFrame Hexagonal Binning Plot.
Table Of Contents:
- Syntax ‘plot.hexbin( )’ Method In Pandas.
- Examples ‘plot.hexbin( )’ Method.
(1) Syntax:
DataFrame.plot.hexbin(x, y, C=None, reduce_C_function=None, gridsize=None, **kwargs)Description:
Generate a hexagonal binning plot.
Generate a hexagonal binning plot of x versus y. If C is None (the default), this is a histogram of the number of occurrences of the observations at
(x[i], y[i]).If C is specified, specifies values at given coordinates
(x[i], y[i]). These values are accumulated for each hexagonal bin and then reduced according to reduce_C_function, having as default the NumPy’s mean function (numpy.mean()). (If C is specified, it must also be a 1-D sequence of the same length as x and y, or a column label.)
Parameters:
- x: int or str – The column label or position for x points.
- y: int or str – The column label or position for y points.
- C: int or str, optional – The column label or position for the value of (x, y) point.
- reduce_C_function: callable, default np.mean – Function of one argument that reduces all the values in a bin to a single number (e.g. np.mean, np.max, np.sum, np.std).
- gridsize: int or tuple of (int, int), default 100 – The number of hexagons in the x-direction. The corresponding number of hexagons in the y-direction is chosen in a way that the hexagons are approximately regular. Alternatively, gridsize can be a tuple with two elements specifying the number of hexagons in the x-direction and the y-direction.
- **kwargs – Additional keyword arguments are documented in
DataFrame.plot().
Returns:
- matplotlib.AxesSubplot – The matplotlib
Axeson which the hexbin is plotted.
(2) Examples Of plot.hexbin() Method:
# The following examples are generated with random data from a normal distribution.
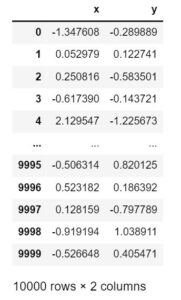
n = 10000
df = pd.DataFrame({'x': np.random.randn(n),
                   'y': np.random.randn(n)})
df
Output:
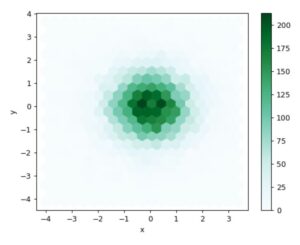
ax = df.plot.hexbin(x='x', y='y', gridsize=20)Output:
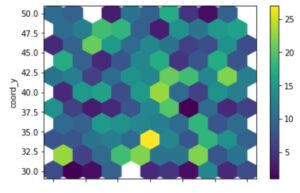
# The next example uses C and np.sum as reduce_C_function. Note that ‘observations’ values ranges from 1 to 5 but the result plot shows values up to more than 25. This is because of the reduce_C_function.
n = 500
df = pd.DataFrame({
    'coord_x': np.random.uniform(-3, 3, size=n),
    'coord_y': np.random.uniform(30, 50, size=n),
    'observations': np.random.randint(1,5, size=n)
    })
df
Output:

ax = df.plot.hexbin(x='coord_x',
                    y='coord_y',
                    C='observations',
                    reduce_C_function=np.sum,
                    gridsize=10,
                    cmap="viridis")
Output: