What Is Bias In Statistics?
Table Of Contents:
- What Is Bias?
- How To Calculate Bias?
- Types Of Bias.
- Examples Of Bias.
- How To Avoid Sampling Bias.
(1) What Is Bias ?

- Bias refers to the inclination for or against one person or group, especially in a way considered to be unfair.
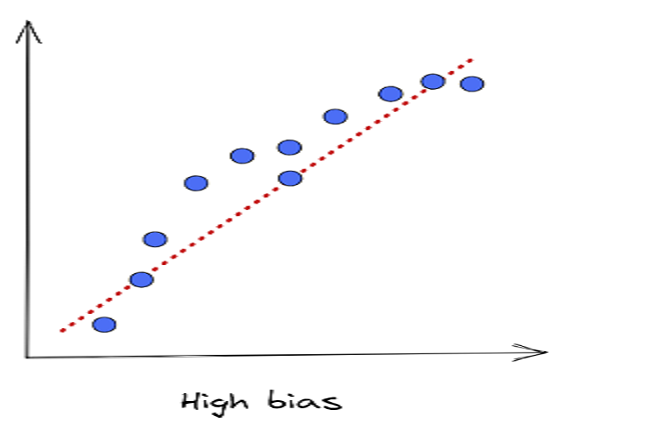
- Bias refers to the flaw in the experiment design or data collection process, which generates results that don’t accurately represent the population.
- Bias mainly occurs due to human action, if you can control the human factor in your experiment, you can reduce the ‘Bias’.
(2) How To Calculate Bias ?
- If you are testing a Hypothesis, if you have ‘Bias’ in your experiment, then your result will be wrong.
- If you are performing any Data Science prediction, Bias will be calculated as the estimated and actual value.
(3) Types Of Bias.
- Sampling Bias.
- Bias In Assignment.
- Omitted Variables.
- Self Serving Bias.
- Experimenter Expectation.
(a) Sampling Bias.
- Sampling bias occurs when some members of a population are systematically more likely to be selected in a sample than others.
- In other words, findings from biased samples can only be generalized to populations that share characteristics with the sample.
Examples Of Sampling Bias.
Examples – 1:
- Asking a group of 9th graders what they believe the speed limit should be on highway is an example of sample bias.
- Yes the 9th graders are starting to become aware of the rules of driving, but their input may be invalid.
- They are not of age to drive and do not represent the entire population of qualified drivers.
Examples – 2:
- People with specific characteristics are more likely to agree to take part in a study than others.
- People who are more thrill-seeking are likely to take part in pain research studies. This may skew the data.
Examples – 3:
- People who refuse to participate or drop out from a study systematically differ from those who take part.
- In a study on stress and workload, employees with high workloads are less likely to participate.
- The resulting sample may not vary greatly in terms of workload.
Examples – 4:
- Some members of a population are inadequately represented in the sample.
- Administering general national surveys online may miss groups with limited internet access, such as the elderly and lower-income households.
Examples – 5:
- Successful observations, people and objects are more likely to be represented in the sample than unsuccessful ones.
- In scientific journals, there is strong publication bias towards positive results.
- Successful research outcomes are published far more often than null findings.
Examples – 6:
- The way participants are pre-screened or where a study is advertised may bias a sample.
- When seeking volunteers to test a novel sleep intervention, you may end up with a sample that is more motivated to improve their sleep habits than the rest of the population.
- As a result, they may have been likely to improve their sleep habits regardless of the effects of your intervention.
Examples – 7:
- Volunteers for preventative interventions are more likely to pursue health-boosting behaviors and activities than other members of the population.
- A sample in a preventative intervention has a better diet, higher physical activity levels, abstains from alcohol, and avoids smoking more than most of the population.
- The experimental findings may be a result of the treatment interacting with these characteristics of the sample, rather than just the treatment itself.
(b) Bias In Assignment.
- If you are going to compare two or more groups, it is important that every case in the sample should have an equal likelihood of being assigned to each experimental condition.
Examples
- Let’s say the creators of an online business course think that the more times they get a visitor to come to their website, the more likely they are to enroll.
- One might mistakenly conclude that more site visits lead to more enrollment.
- Because each person didn’t have an equal chance of being in each experimental group—visiting the site five, three, and one time, respectively—it can’t be concluded that the number of site visits leads to enrollment in the course.
(c) Omitted Variables.
- When analyzing trends in data, it’s important to consider all variables, including those not accounted for in the experimental design.
- Just because two variables are correlated doesn’t mean one caused the other—there could be additional variables at play.
Examples
- There was a high correlation between the number of storks in various European countries and the human birth rates in those countries.
- The correlation between the two variables was an extremely significant 0.62.
- The high correlation between the two variables doesn’t imply that a high stork population causes an increase in birth rate.
- Rather, there’s a third variable at play: geographic area. Large countries have more people living in them—hence higher birth rates and a higher stork population.
- Rerunning the analysis and including area as an independent variable solves this mystery.
- While it may not be possible to identify all omitted variables, a good research model explores all variables that might impact the dependent variable.
(d) Self Serving Bias.
- When you ask people to take a survey, you will see that people always rate them selves higher in good attributes and avoid giving correct answers to the bad attributes.
Examples
- When you went for a job interview, for punctuality you fill highly punctual.
- But for alcohol consumption you filled no.
- Here you can’t conclude punctuality and alcohol consumption are highly correlated.
(e) Experimenter Expectations.
- If researchers have pre-existing ideas about the results of a study, they can accidentally have an impact on the data, even if they’re trying to remain objective.
- For example, interviewers or focus group facilitators can subtly influence participants through unconscious verbal or non-verbal cues.
Examples
- In 1907, a horse named Clever Hans was famous for successfully completing complex mathematical operations and tapping out the answer with his hoof.
- It was later discovered that he was responding to the involuntary body language of the person posing the problems.
To avoid experimenter bias, studies that require human intervention to gather data often use blind data collectors who don’t know what’s being tested.