What Is Exponential Distribution?
Table Of Contents:
- What Is Exponential Distribution?
- Formula For Exponential Distribution.
- Diagram For Exponential Distribution.
- Examples Of Exponential Distribution.
(1) What Is Exponential Distribution?
- The Exponential Distribution is a continuous distribution that is commonly used to measure the expected time for an event to occur.
- For example, in physics, it is often used to measure radioactive decay.
- In engineering, it is used to measure the time associated with receiving a defective part on an assembly line.
- In finance, it is often used to measure the likelihood of the next default for a portfolio of financial assets.
- For example, the amount of time (beginning now) until an earthquake occurs has an exponential distribution.
- Other examples include the length, in minutes, of long-distance business telephone calls, and the amount of time, in months, a car battery lasts.
(2) Formula For Exponential Distribution.
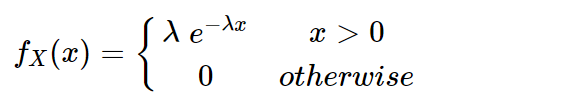
where e represents a natural number
λ = mean time between the events, also known as the rate parameter, and is λ > 0
x = random variable
- The continuous random variable, say X is said to have an exponential distribution if it has the above probability density function.
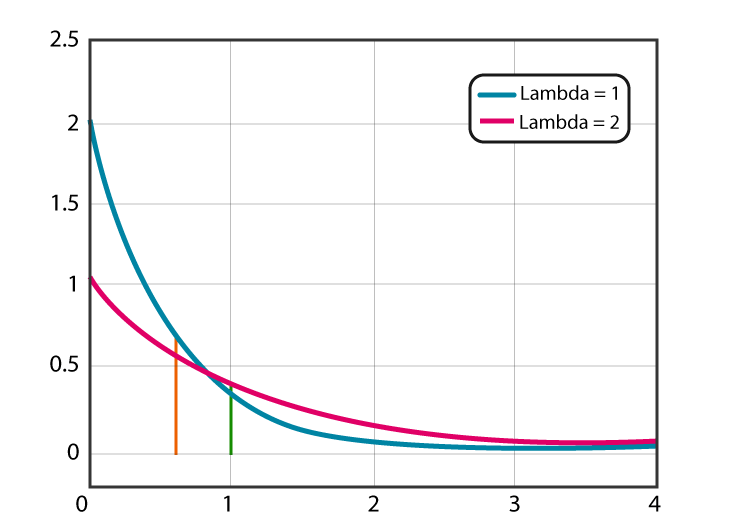
(3) Diagram For Exponential Distribution.
- The exponential distribution graph is a graph of the probability density function which shows the distribution of distance or time taken between events.
- The two terms used in the exponential distribution graph are lambda (λ)and x.
- Here, lambda represents the events per unit time and x represents the time.
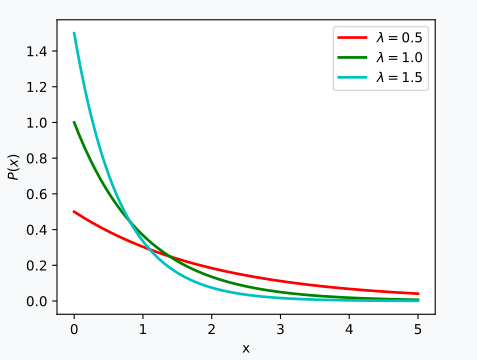
- The following graph shows the values for λ=0.5, λ=1.0, and λ=1.5.
(4) Examples Of Exponential Distribution.
Examples-1: Question
- Assume that, you usually get 2 phone calls per hour. calculate the probability, that a phone call will come within the next hour.
Solution:
- It is given that, 2 phone calls per hour. So, it would expect that one phone call every half an hour.
λ = 0.5
So, the computation is as follows:
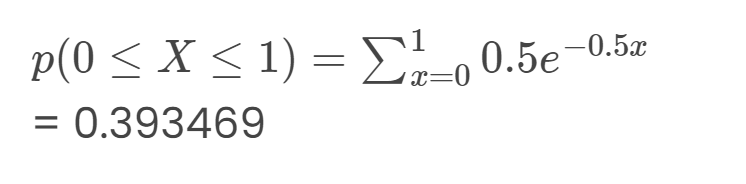
- Therefore, the probability of arriving the phone calls within the next hour is 0.393469
Examples-2: Question
- Let us determine the amount of time taken (in minutes) by office personnel to deliver a file from the manager’s desk to the clerk’s desk.
- The function of time taken is assumed to have an exponential distribution with the average amount of time equal to 5 minutes.
- Also, x is a continuous random variable. Based on the given data, determine the exponential distribution.
Solution:
Given:
x = time taken to deliver a file in minutes
μ = 5 minutes
Therefore, the scale parameter is:
λ = 1 / μ
λ = 1 / 5 = 0.20
Hence, the exponential distribution probability function can be derived as,
f (x; λ) = 0.20 e – 0.20*x
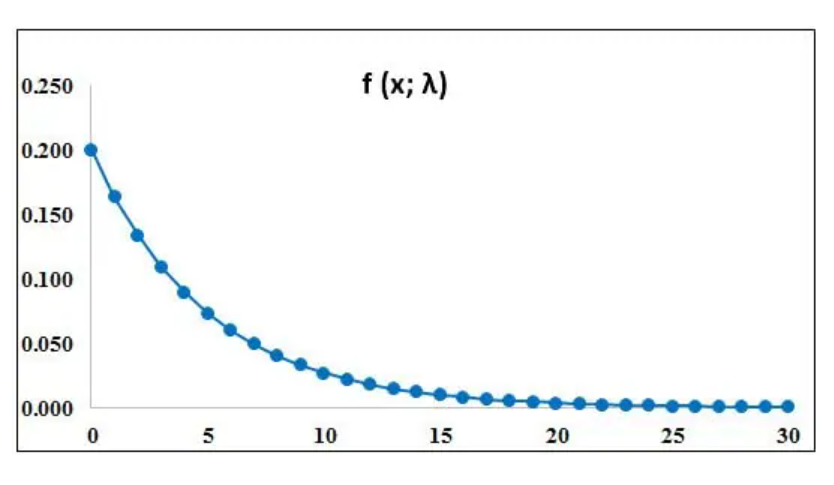
Now, calculate the probability function at different values of x to derive the distribution curve.
For x = 0
- For x = 0, f(0) = 0.20 e -0.20*0 = 0.200
- For x = 1, f(1) = 0.20 e -0.20*1 = 0.164
- For x = 2, f(2) = 0.20 e -0.20*2 = 0.134
Examples-3:
How much time will elapse before an earthquake occurs in a given region?
How long do we need to wait until a customer enters our shop?
How long will it take before a call center receives the next phone call?
How long will a piece of machinery work without breaking down?
All these questions concern the time we need to wait before a given event occurs.
If this waiting time is unknown, it is often appropriate to think of it as a random variable having an exponential distribution.
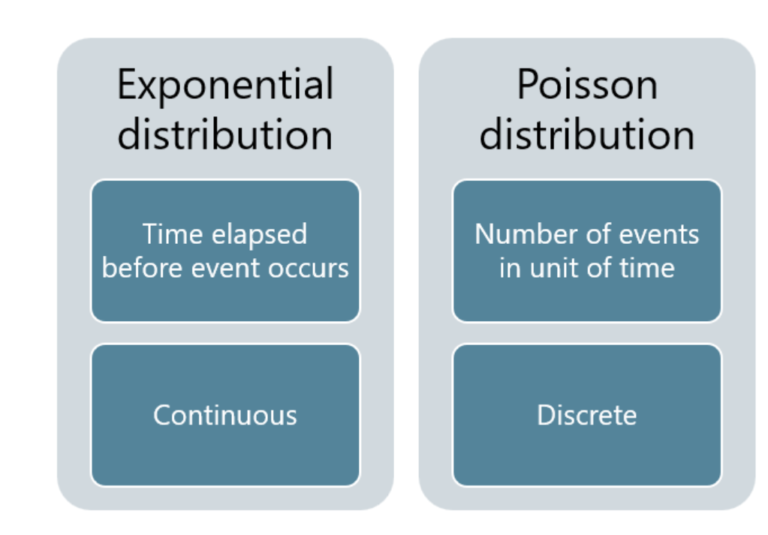
(5) Exponential Distribution vs Poisson Distribution.