What Is Student’s T – Distribution?
Table Of Contents:
- What is Student’s T – Distribution?
- Formula For Student’s T – Distribution.
- Diagram For Student’s T – Distribution.
- Examples Of Student’s T – Distribution.
(1) What Is Student’s T – Distribution?
- Student’s t-distribution, also known as the t-distribution, is a continuous probability distribution that is used in statistics for making inferences about the population mean when the sample size is small or when the population standard deviation is unknown.
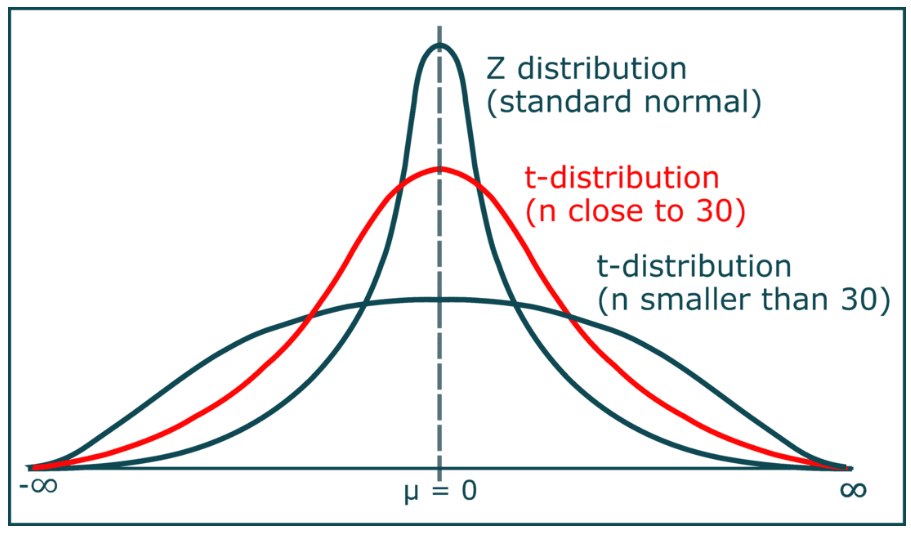
- It is similar to the standard normal distribution (Z-distribution), but it has heavier tails.
- The t-distribution is used instead of the normal distribution when you have small samples.
- The larger the sample size, the more the t distribution looks like the normal distribution.\
- In fact, for sample sizes larger than 20 (e.g. more degrees of freedom), the distribution is almost exactly like the normal distribution.
(2) Formula For Student’s T – Distribution?
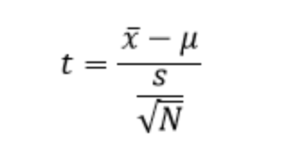
where,
t = The t-score,
x̄ = sample mean,
μ = population mean,
s = standard deviation of the sample,
N = sample size
(3) Diagram For Student’s T – Distribution?
(4) When To Use Student’s T – Distribution?
Student’s t Distribution is used when
- The sample size is 30 or less than 30.
- The population standard deviation(σ) is unknown.
- The population distribution must be unimodal and skewed.
(5) Characteristics Of Student’s T – Distribution?
- The t-distribution is a type of normal distribution that is used for smaller sample sizes.
- Normally-distributed data form a bell shape when plotted on a graph, with more observations near the mean and fewer observations in the tails.
- The t-distribution is used when data are approximately normally distributed, which means the data follow a bell shape but the population variance is unknown.
- The variance in a t-distribution is estimated based on the degrees of freedom of the data set (total number of observations minus 1).
- It is a more conservative form of the standard normal distribution, also known as the z-distribution.
- This means that it gives a lower probability to the center and a higher probability to the tails than the standard normal distribution.
(6) Examples Of Student’s T – Distribution?
Example-1: Question
- The CEO of light bulbs manufacturing company claims that an average light bulb lasts 300 days.
- A researcher randomly selects 15 bulbs for testing. The sampled bulbs last an average of 290 days, with a standard deviation of 50 days.
- If the CEO’s claim were true, what is the probability that 15 randomly selected bulbs would have an average life of no more than 290 days?
Solution:
- x̄ = is the sample mean,
- μ = is the population mean, s is the standard deviation of the sample, and n is the sample size.
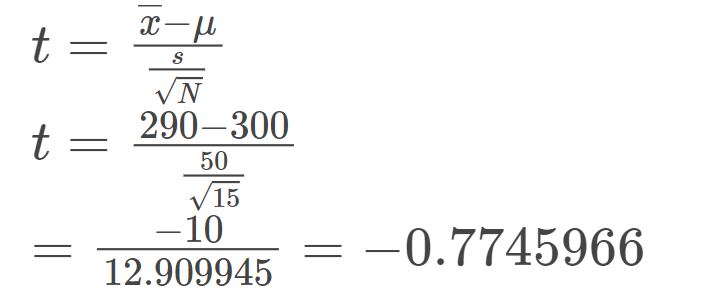
Using the formula:
Since we will work with the raw data, we select “Sample mean” from the Random Variable dropdown box.
- The degrees of freedom are equal to 15 – 1 = 14.
- Assuming the CEO’s claim is true, the population mean equals 300.
- The sample mean equals 290.
- The standard deviation of the sample is 50.
- The cumulative probability: 0.226.
- Hence, if the true bulb life were 300 days, there is a 22.6% chance that the average bulb life for 15 randomly selected bulbs would be less than or equal to 290 days
Example-2: Question
- ABC Poultry Farms supplies eggs. The company claims its eggs remain fresh for five days if refrigerated.
- An analyst samples 25 eggs to test this claim. The average freshness of eggs was 4.5 days, with a standard deviation of a day.
- If the company’s claim is true, find the probability of all selected eggs lasting about 4.5 days.
Solution:
Given:
- x̄ = 4.5 days
- μ = 5 days
- s = 1 day
- n = 25
Therefore,
t = (x̄-µ)/(s/√n)
t = (4.5 – 5)/(1/√25)
t = -0.5/0.2 = -2.5
Since the minus sign is irrelevant here, we get t = 2.5.
Degree of Freedom (df) = n – 1
df = 25 – 1 = 24
Thus, according to the t-test, the probability (p-value) of eggs not lasting for more than 4.5 days is 0.01965418.
Note: To find the p-value, we have substituted the values of t-score and degree of freedom into an online calculator to get the result: 0.01965418.
Example-3: Question
- Mahindra Company claims that the ‘THAR’ car gives average milage of 20km/l.
- I can test this claim by examining 10 ‘THAR’ cars and can find it’s milage with some standard deviation.
- I can also find out the probability of happening that by using T-Distribution.